Area Chart Preset
Area
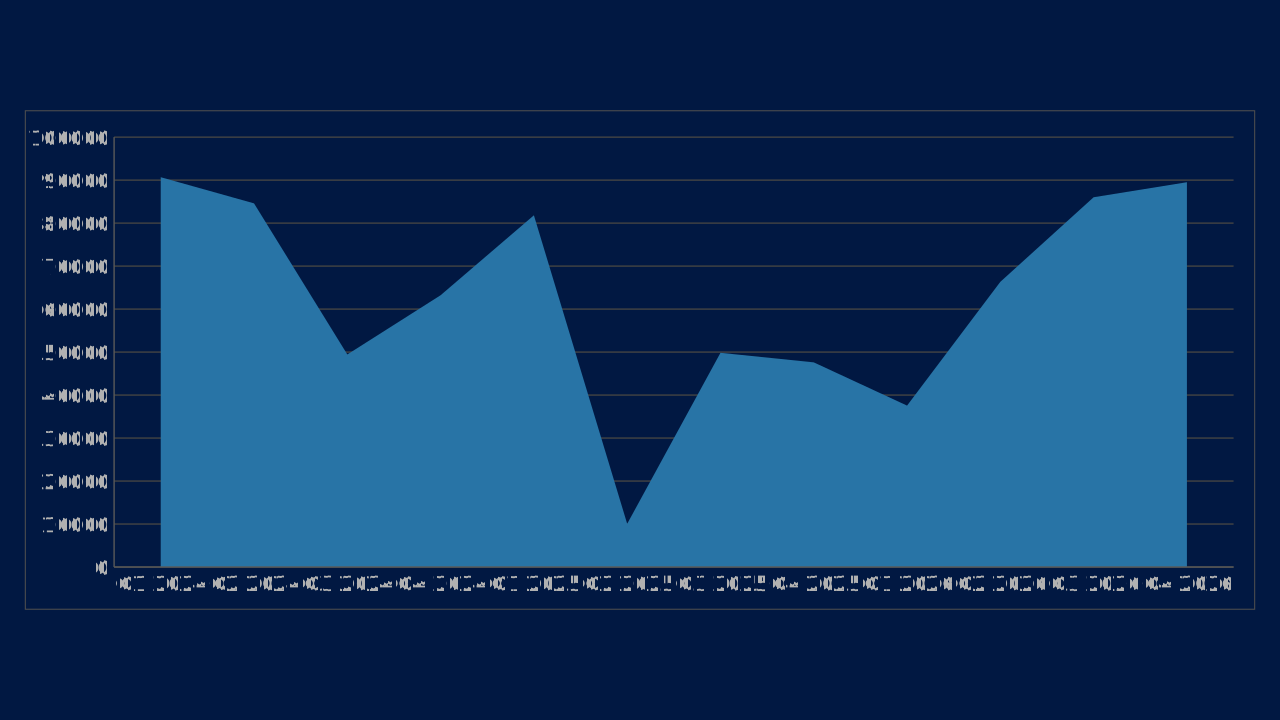
Area is an OPF area chart preset with canonical workbook metadata, sample data, and engine chart type mapping.
Use Case
Show trend direction while giving visual weight to magnitude or contribution.
Data Requirements
1 series, 12 categories, flat category/series workbook
Group
Filled trend charts that emphasize volume, accumulation, or composition over time.
Series
1 series across 12 categories
Workbook Range
Sheet1!$A$1:$M$2
When to Use
Use when cumulative volume or segment contribution is part of the argument.
When to Avoid
Avoid when overlapping areas hide exact values or when many series compete.
Series colors
By default a chart takes its series colors from the deck's color scheme. Series 1 to 6 use accent1 to accent6 of the scheme in that order; series 7 to 12 use the same six accents mixed 40% toward white (series 7 is a tint of accent1). A pie, doughnut, treemap or funnel gives category i color i. Charts with more than twelve series repeat the list.
Put the series that carries the message first, because accent1 is the deck's primary, and keep a chart to six series or fewer so no tint is needed. Each color is then adjusted so it keeps 3:1 contrast against the chart panel and stays apart from its neighbours; on a dark panel colors are lightened, never merged.
To set a series color yourself, give the chart chart.colors: a list of up to 24 colors by position, where entry i replaces the palette color of series (or slice, for a pie) i and the rest of the palette is unchanged. An entry is any ColorRef: a hex color, a color-scheme slot or role such as accent3 (it follows the deck if its scheme changes), or a var: color variable. The contrast adjustment still applies to authored colors, and the opf/chart-colors-adjusted warning says when an entry was unresolvable or had to be moved.
"chart": {
  "type": "column",
  "data": { "columns": ["Quarter", "Revenue", "Costs"], "rows": [["Q1", 12, 8], ["Q2", 18, 11]] },
  "colors": ["accent3", "#7B241C"]
}
highlight wins over both: the series and categories it names take the deck's primary color and every other mark takes a muted neutral, whatever chart.colors says.
Core 0.21.0 behavior.
Best Practices
Use transparency deliberately
Keep stacking order stable
Reserve heavy fills for high-level stories
Recommended Companions
OPF Config
charts:area{
"$schema": "https://openpresentation.org/schema/opf/v1",
"name": "PPTX.gallery — charts/area",
"description": "Area is an OPF area chart preset with canonical workbook metadata, sample data, and engine chart type mapping.",
"tags": [
"gallery:charts/area"
],
"slides": [
{
"id": "gallery-preview-1",
"layout": "chart",
"title": "Area",
"subtitle": "Show trend direction while giving visual weight to magnitude or contribution.",
"chart": {
"type": "area",
"data": {
"columns": [
"Category",
"Value"
],
"rows": [
[
"Q1 2024",
90676
],
[
"Q2 2024",
84593
],
[
"Q3 2024",
49446
],
[
"Q4 2024",
63225
],
[
"Q1 2025",
81819
],
[
"Q2 2025",
10053
],
[
"Q3 2025",
49829
],
[
"Q4 2025",
47606
],
[
"Q1 2026",
37549
],
[
"Q2 2026",
66346
],
[
"Q3 2026",
86019
],
[
"Q4 2026",
89516
]
]
}
}
}
],
"catalogs": {
"default": {
"source": "https://www.pptx.gallery",
"layouts": {
"chart": {
"name": "Chart",
"summary": "One to six charts, with an optional note.",
"tags": [
"Visuals"
],
"direction": "column",
"regions": [
{
"name": "title"
},
{
"name": "charts",
"accepts": [
"chart",
"group"
],
"role": "primary",
"flow": "grid"
},
{
"name": "note",
"size": "auto",
"accepts": [
"text"
],
"role": "supporting",
"flow": "none"
}
],
"description": "Give a chart enough space to show its evidence. Use the title to state the conclusion and labels to explain the measures.",
"preview": {
"vectorSrc": "https://www.pptx.gallery/layout-previews/chart.svg"
}
}
}
}
}
}Load this config in the gallery's visual editor, or in the Inspector at pptx.dev.