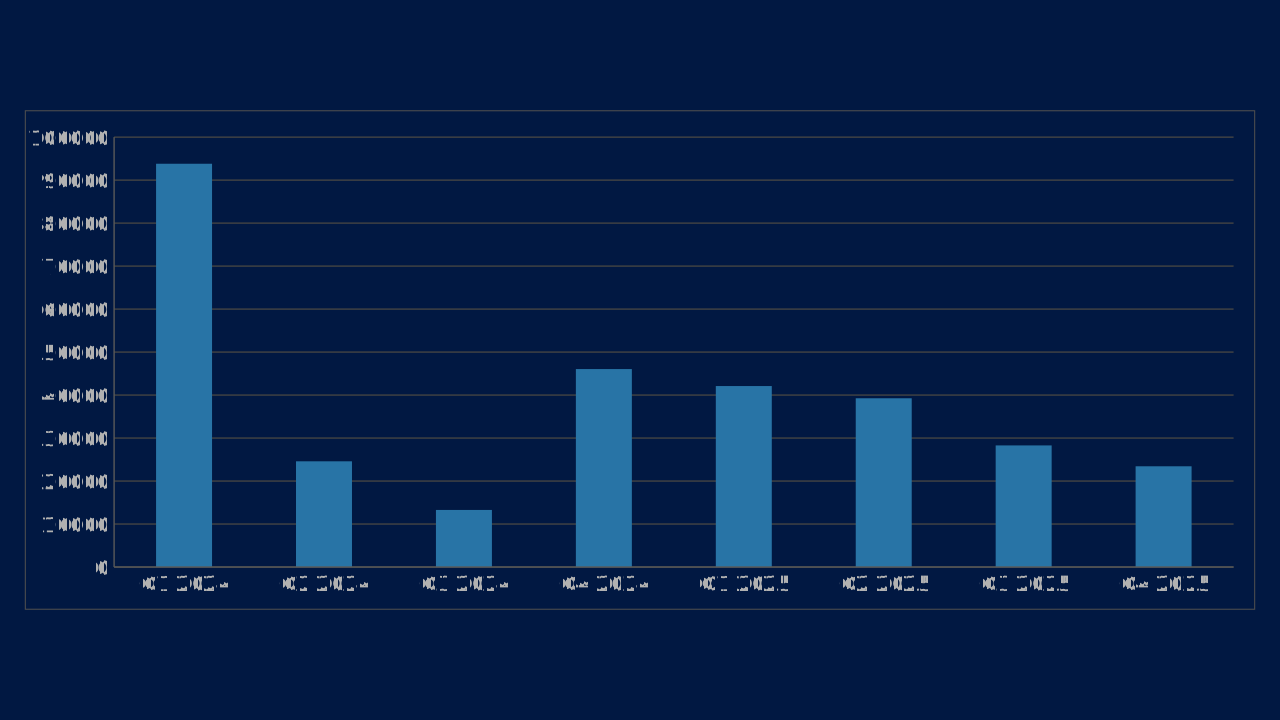
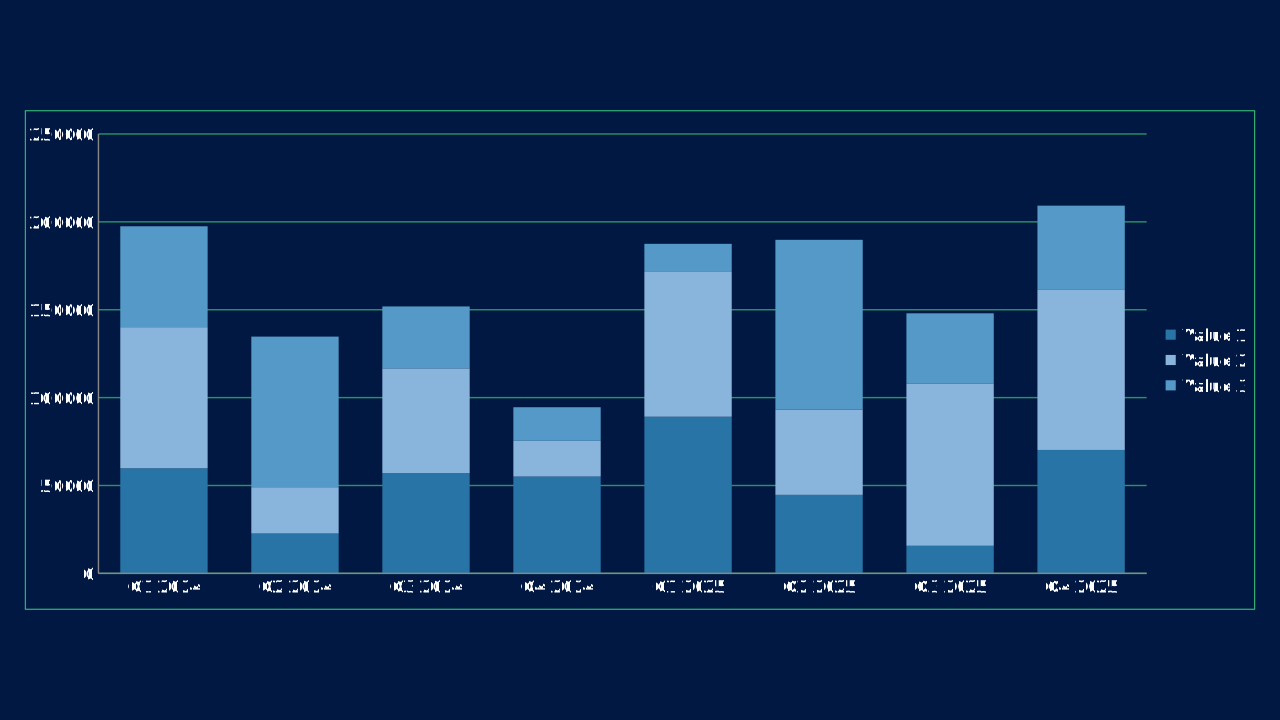
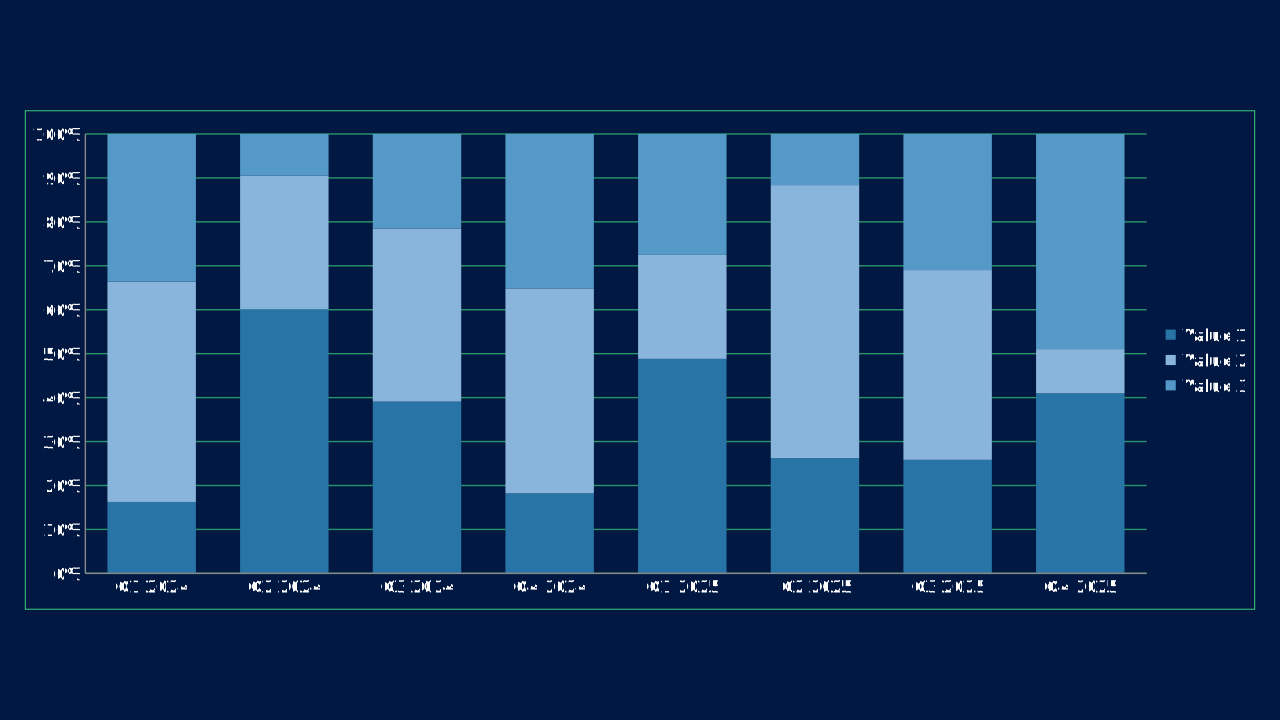
Column
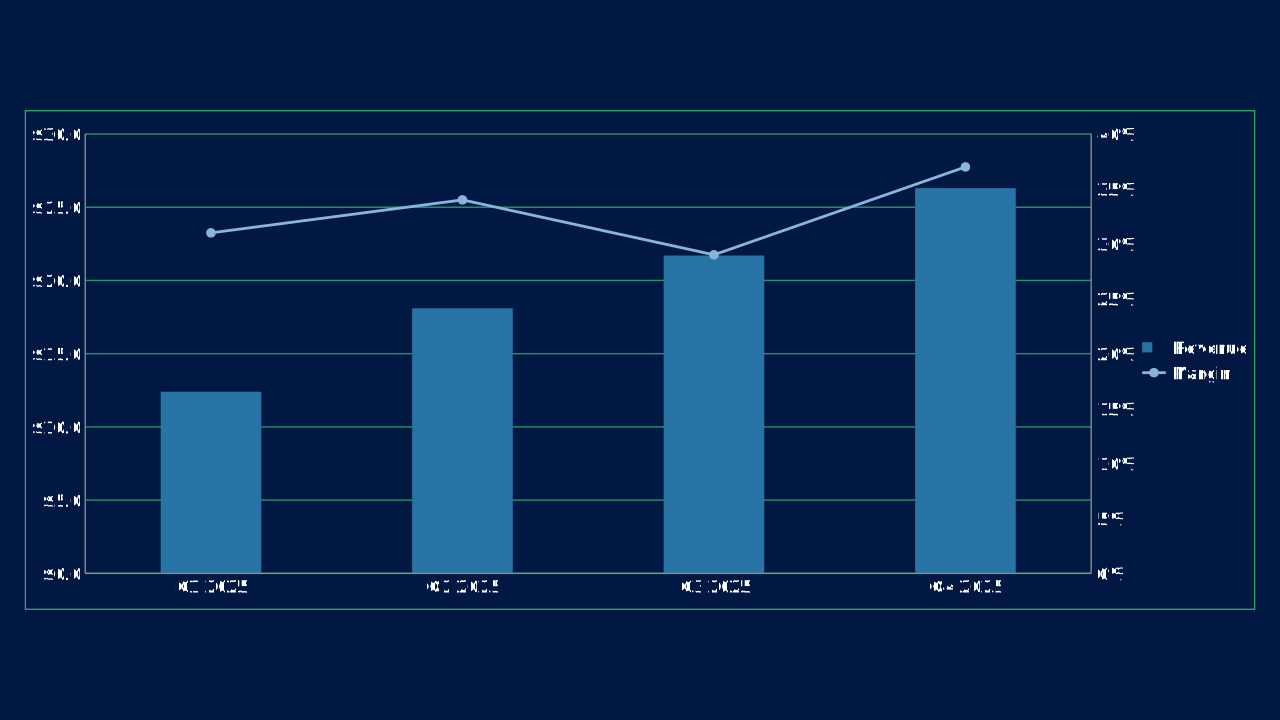
Vertical comparisons across categories, time periods, or grouped series.
Charts
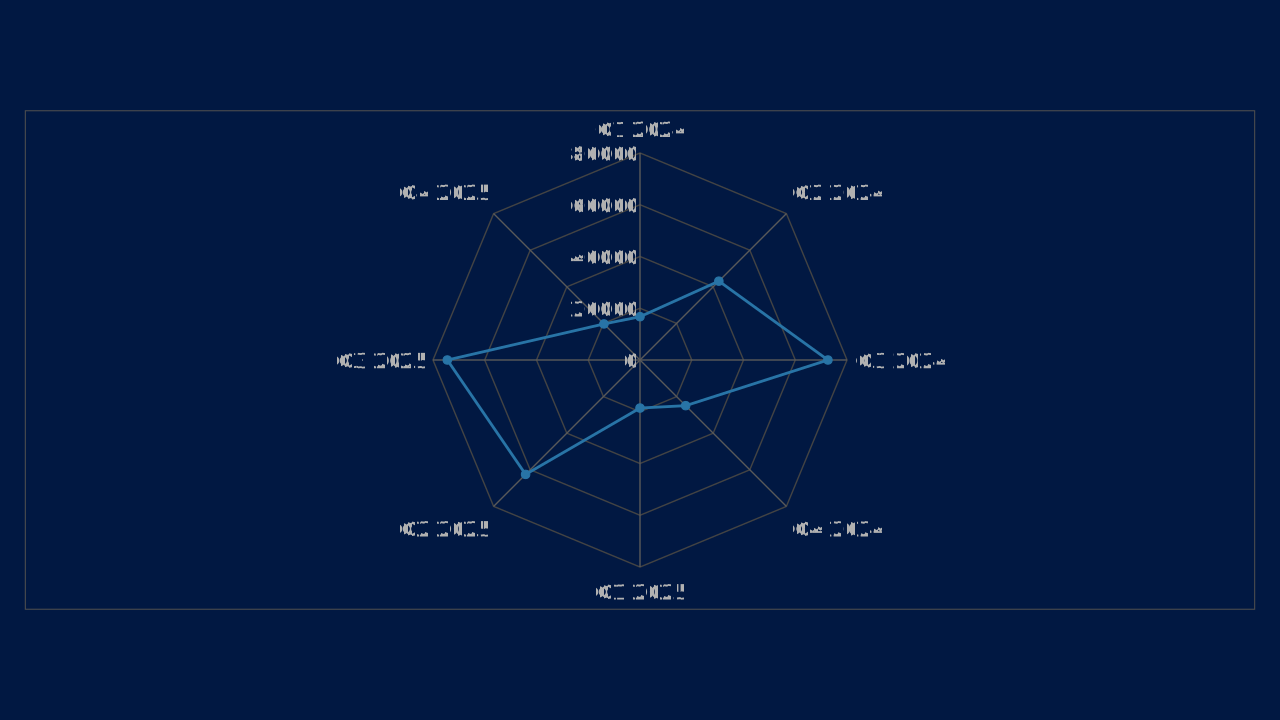
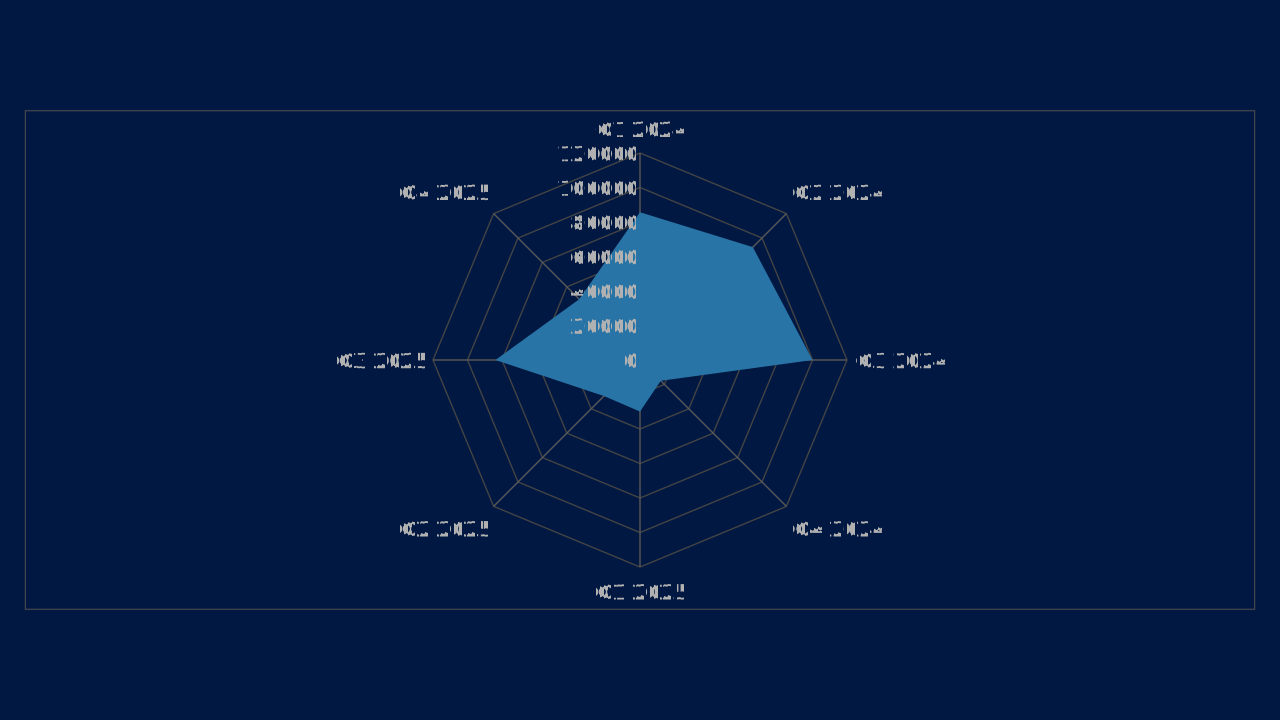
Charts turn data into an argument. Use this OPF reference to select a chart by analytical purpose, understand the data shape it expects, and copy a chartPreset snippet with sample data.
Column
Vertical comparisons across categories, time periods, or grouped series.
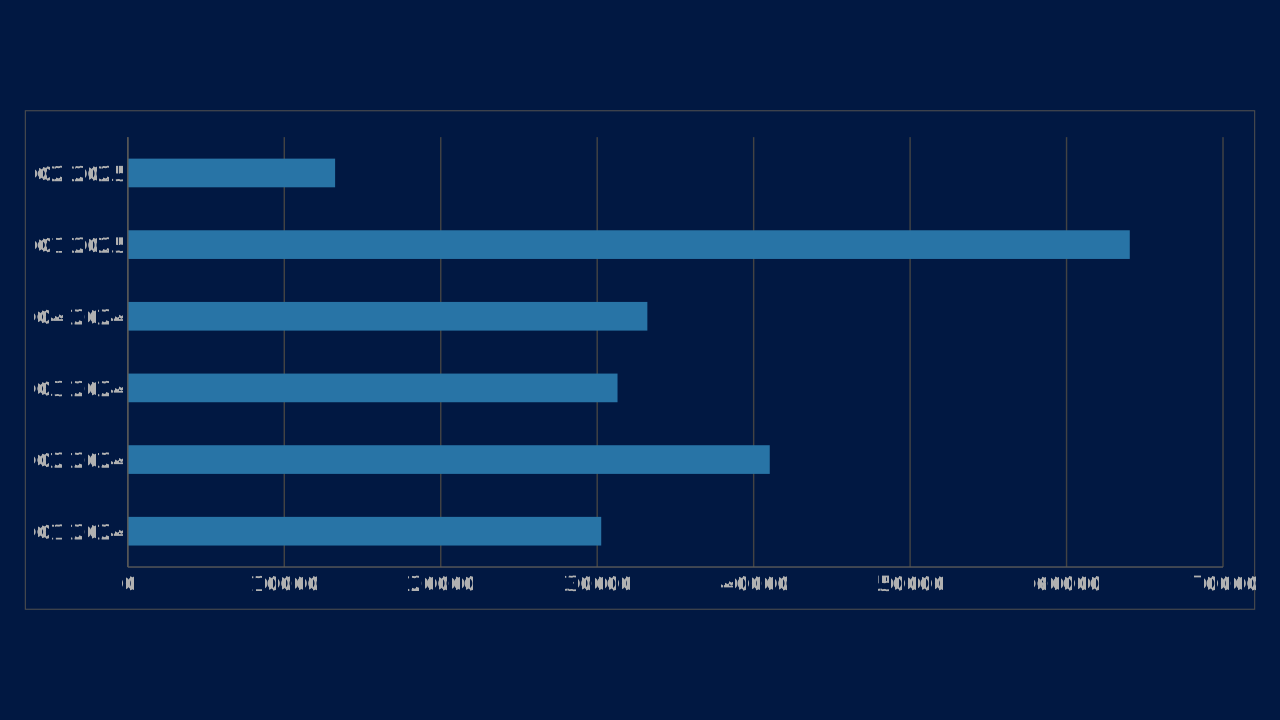
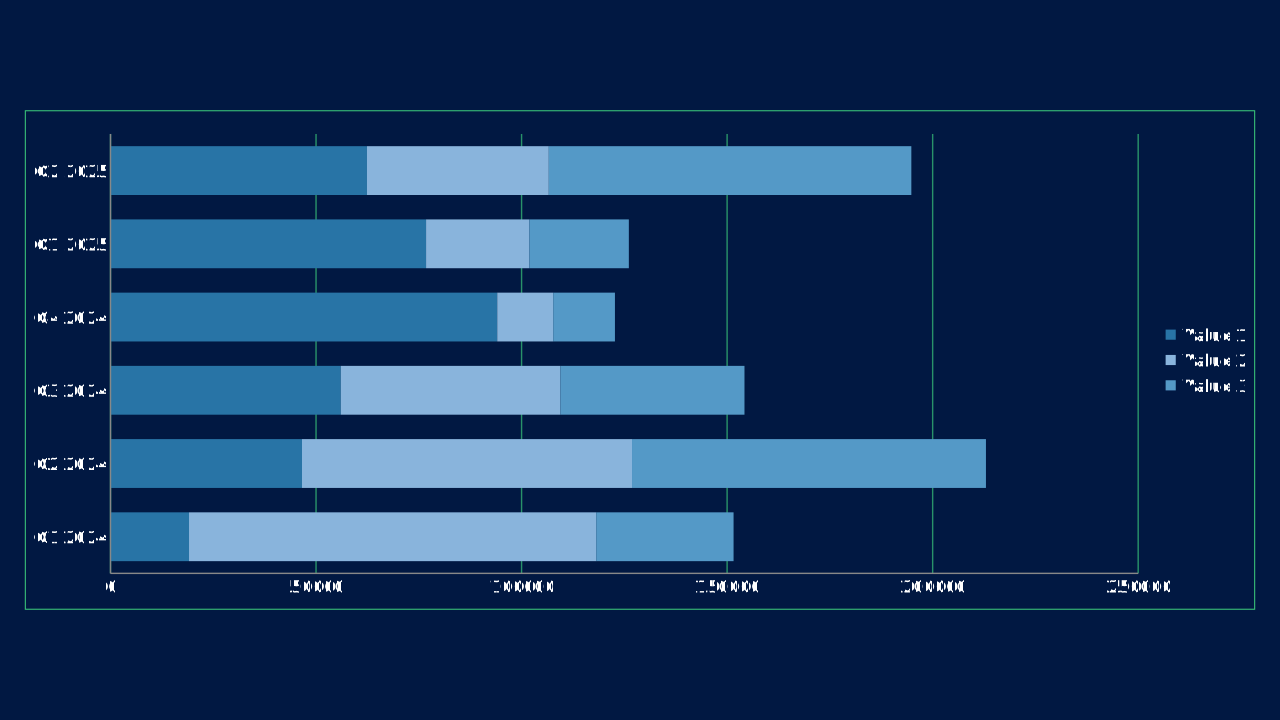
Bar
Horizontal comparisons, ranked values, and progress-style measures.
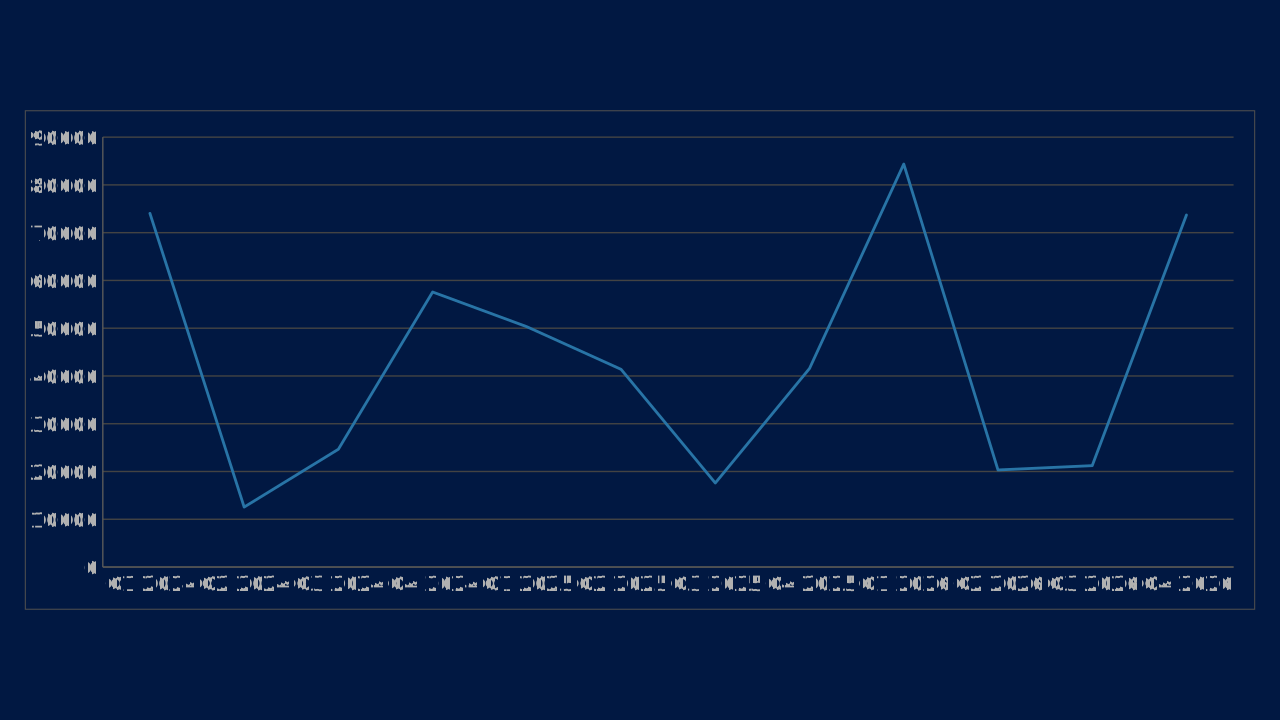
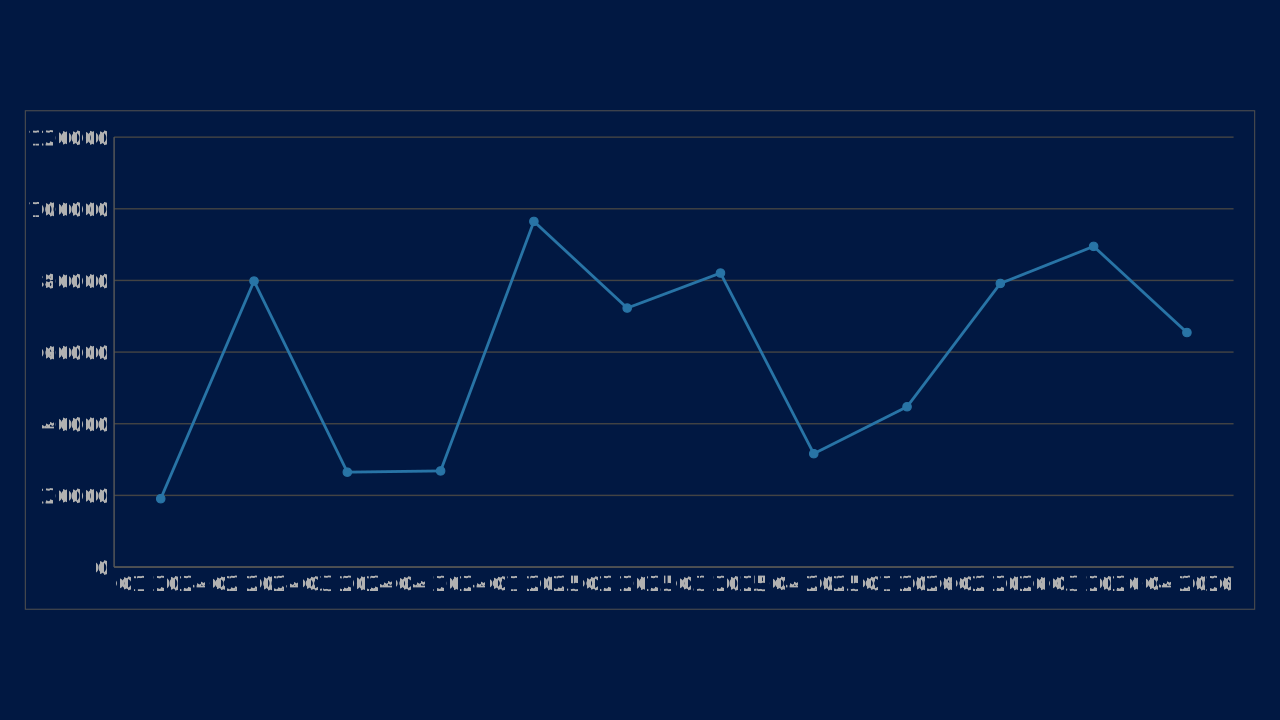
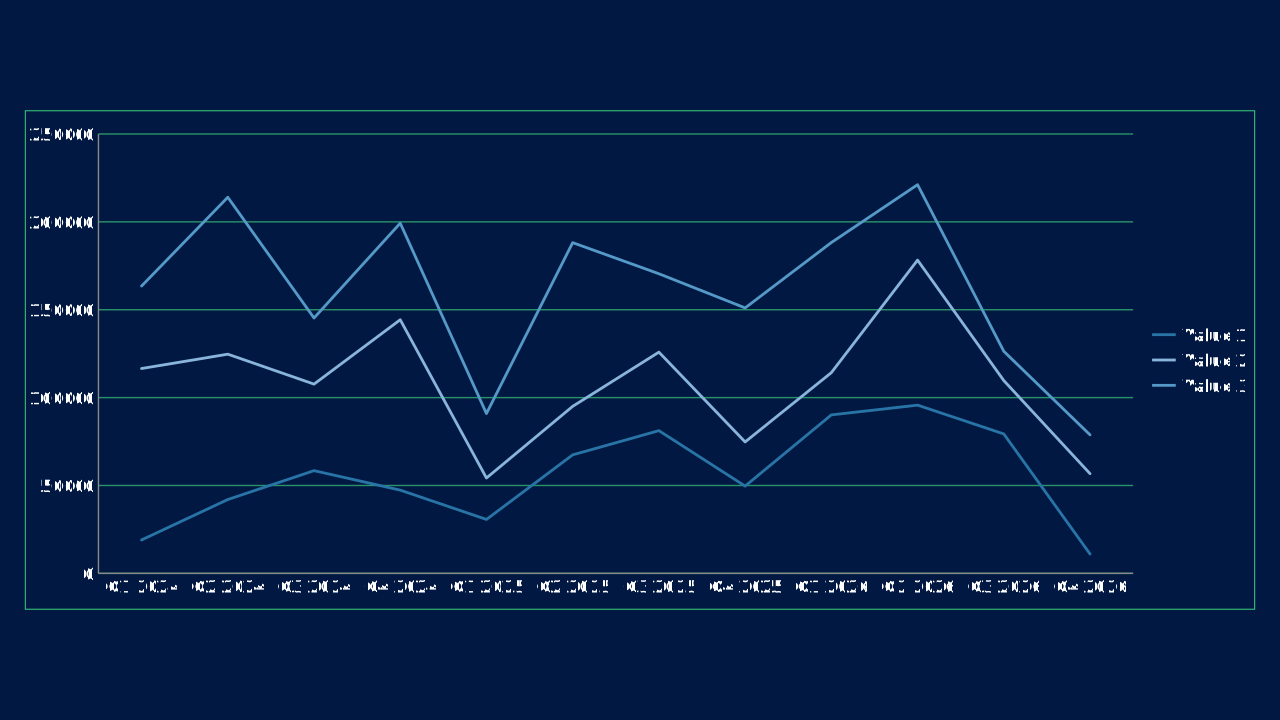
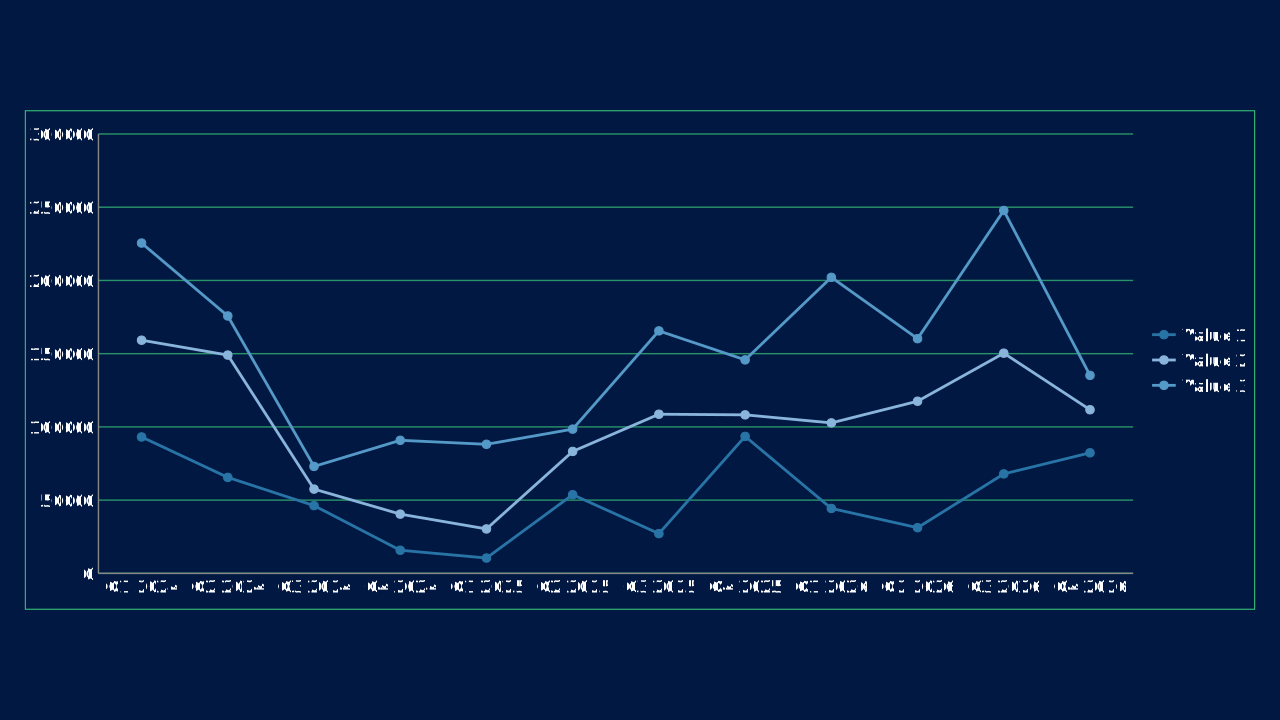
Line
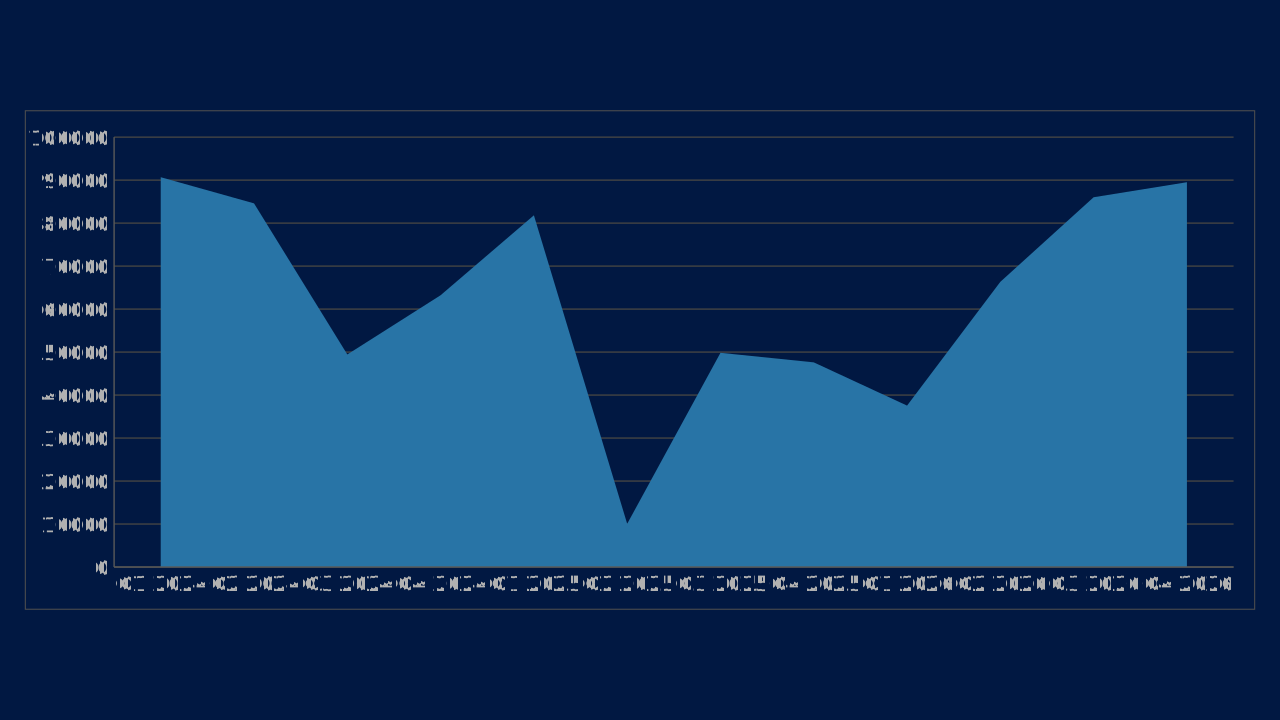
Trend charts for time-series movement and multi-series comparisons.
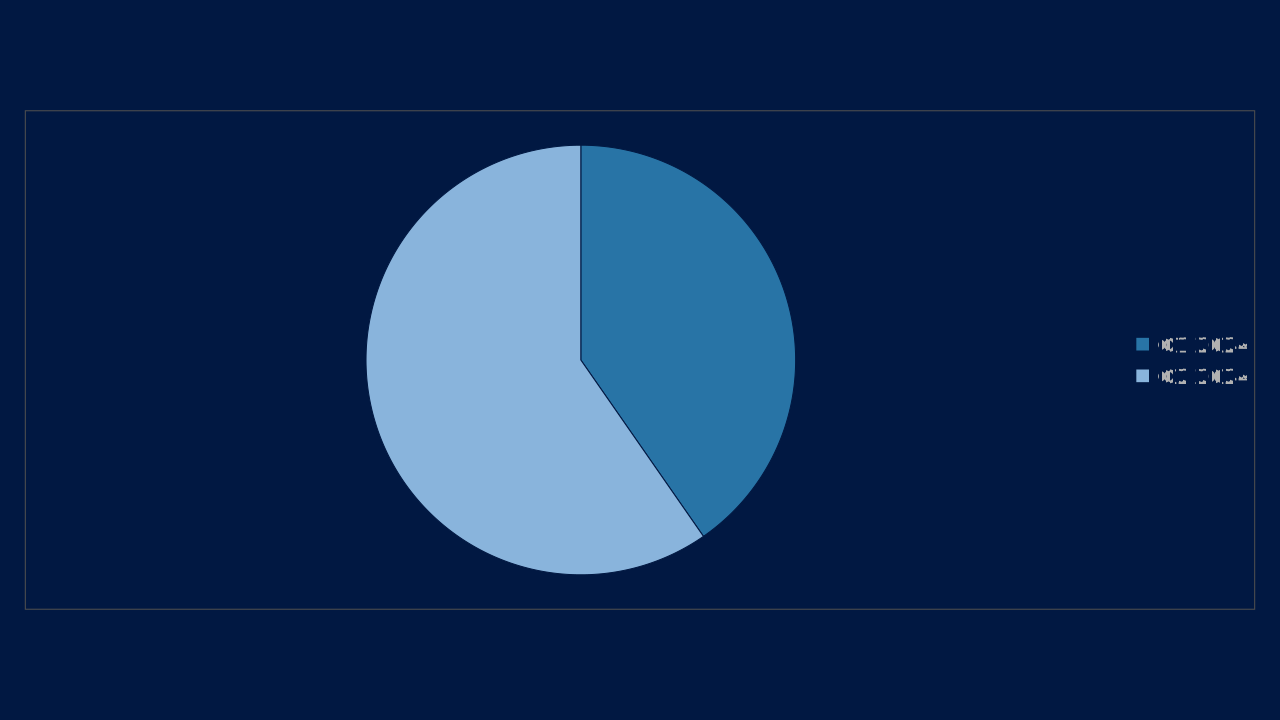
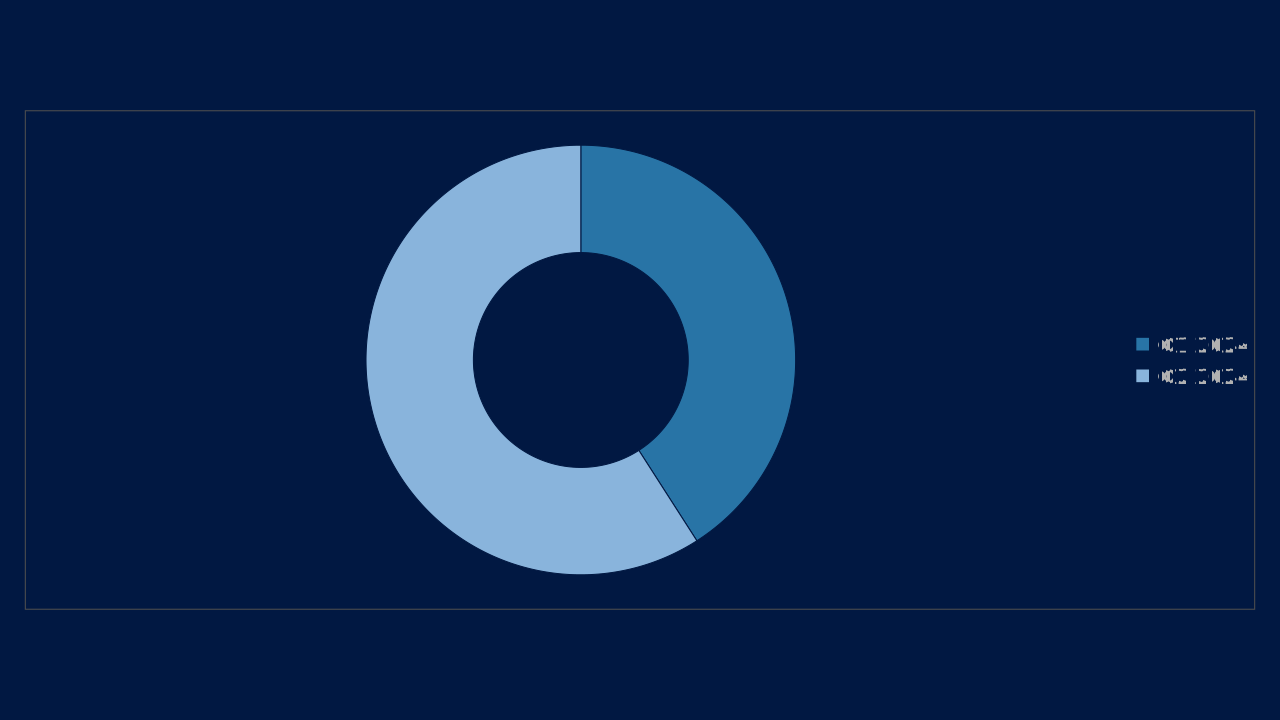
Pie
Part-to-whole charts for a small number of segments.
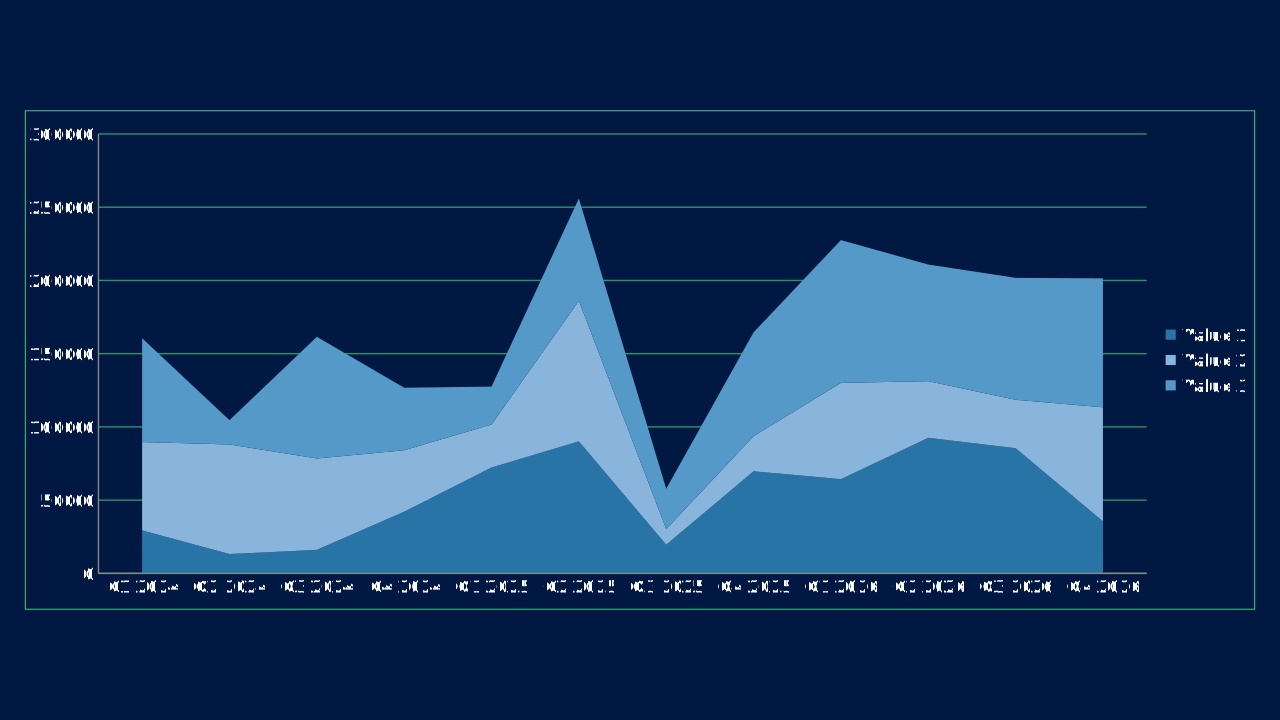
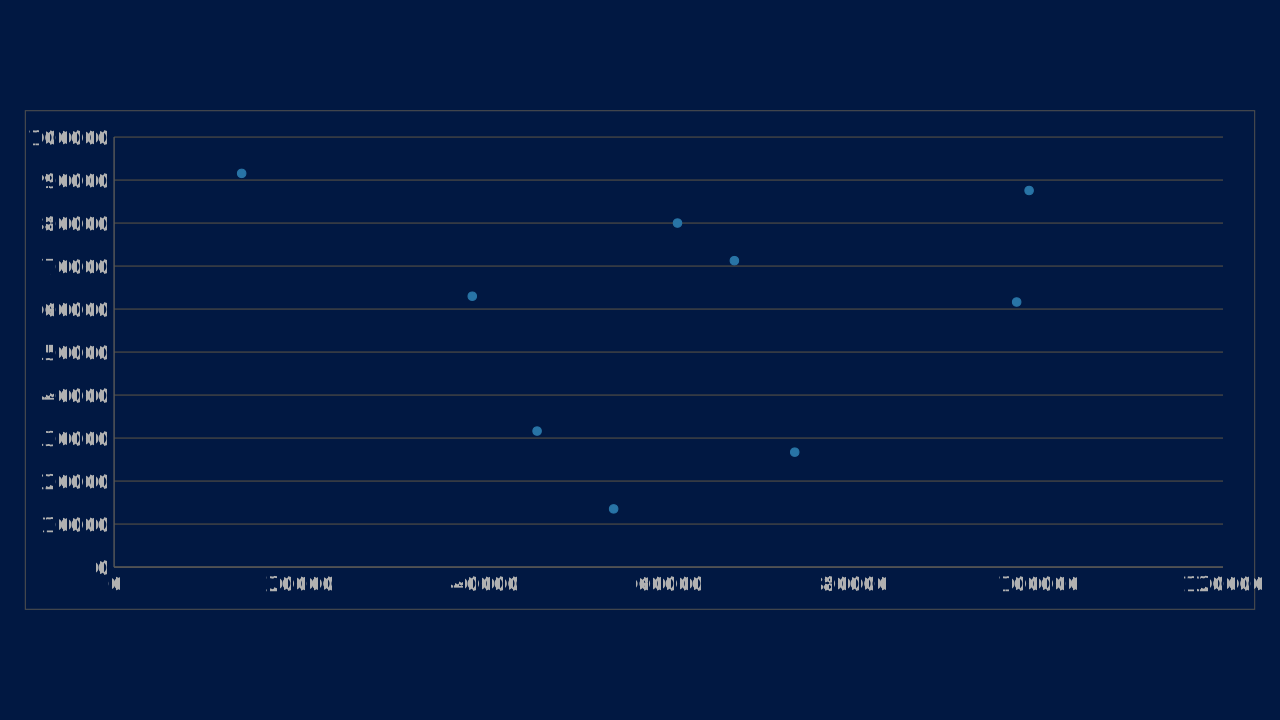
The chart catalog publishes 26 records, one per Aspose.Slides ChartType that OPF supports, from https://github.com/OpenPresentation/opf spec/catalogs/chart-types. Other Aspose.Slides chart types (3D, cylinder/cone/pyramid, pie-of-pie, stock, surface, bubble, sunburst) are not yet OPF records.
OPF snippets use chartPreset with the record id, letting the engine resolve the exact chart preset through catalogs.charts or the default pptx.gallery catalog.
Human guidance fields such as use_case, when_to_use, and when_to_avoid remain additive metadata; they do not replace or reshape OPF fields.
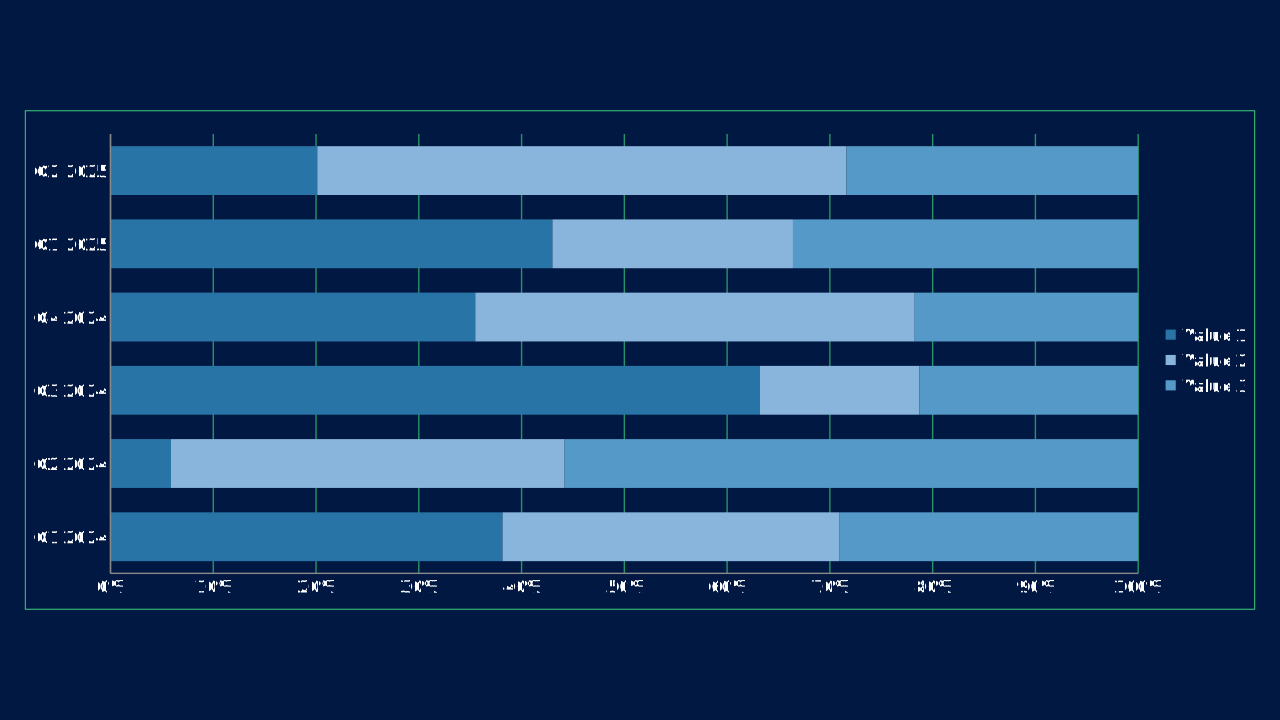
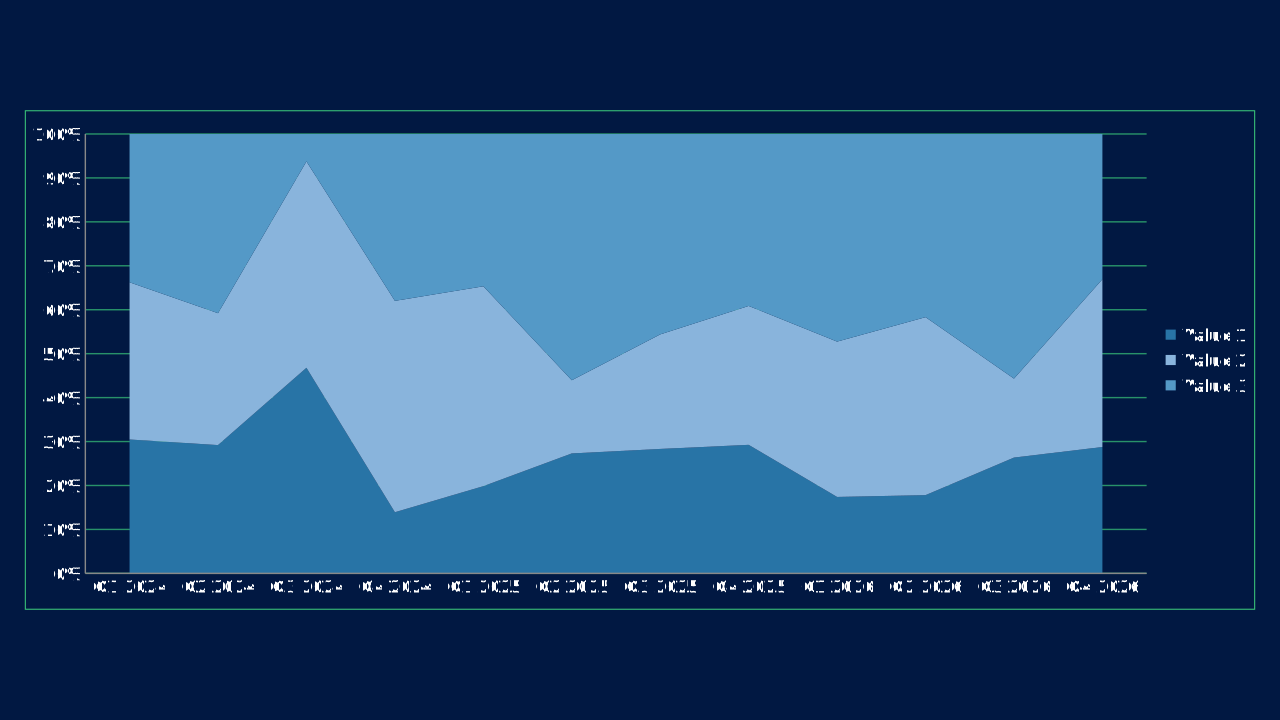
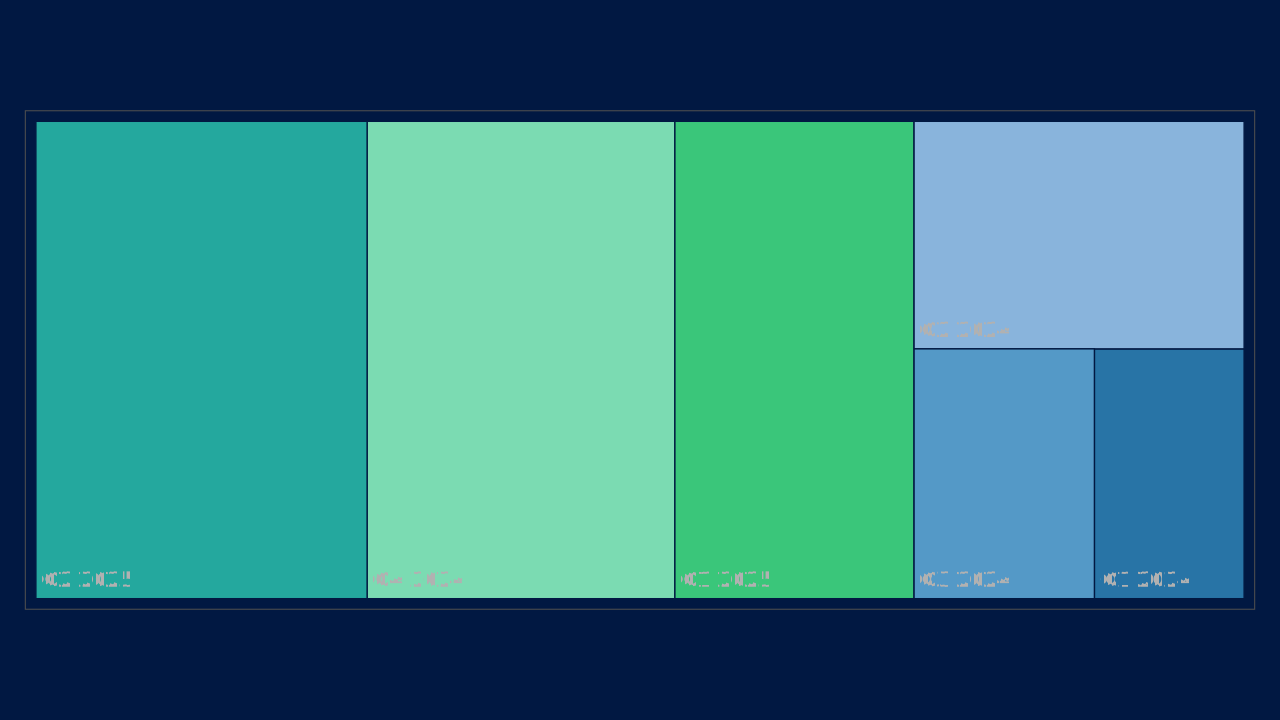
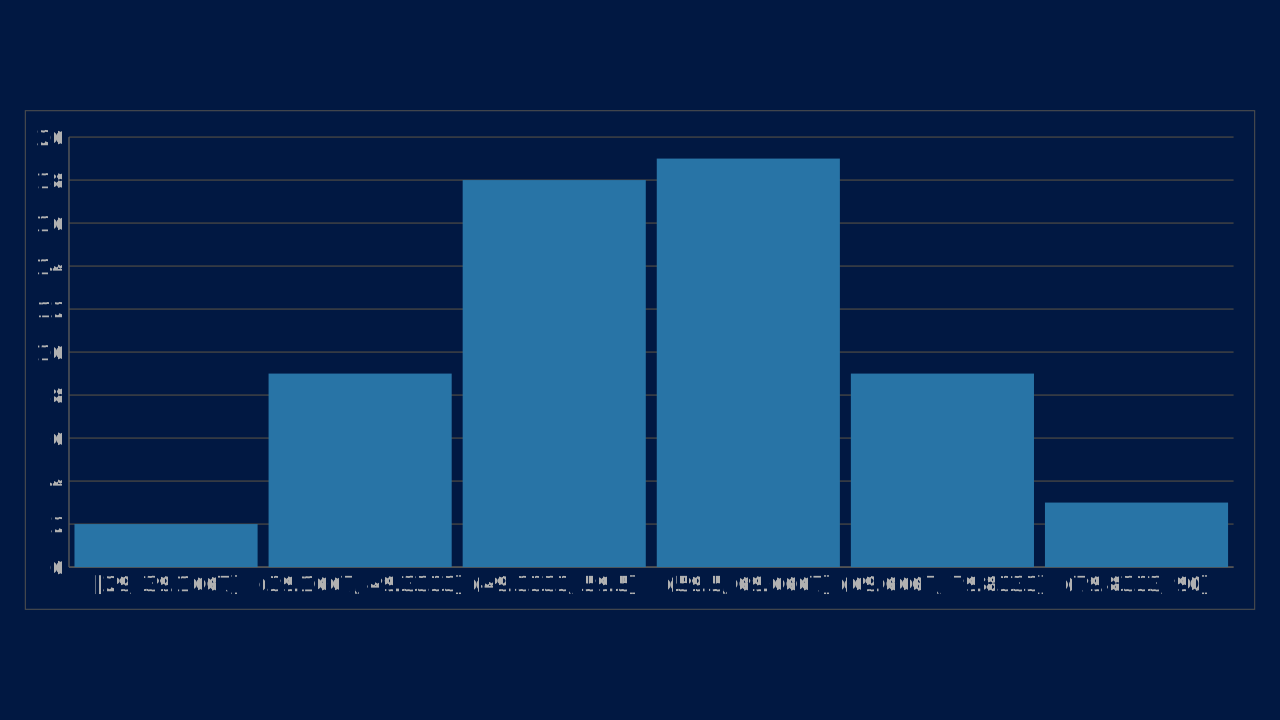
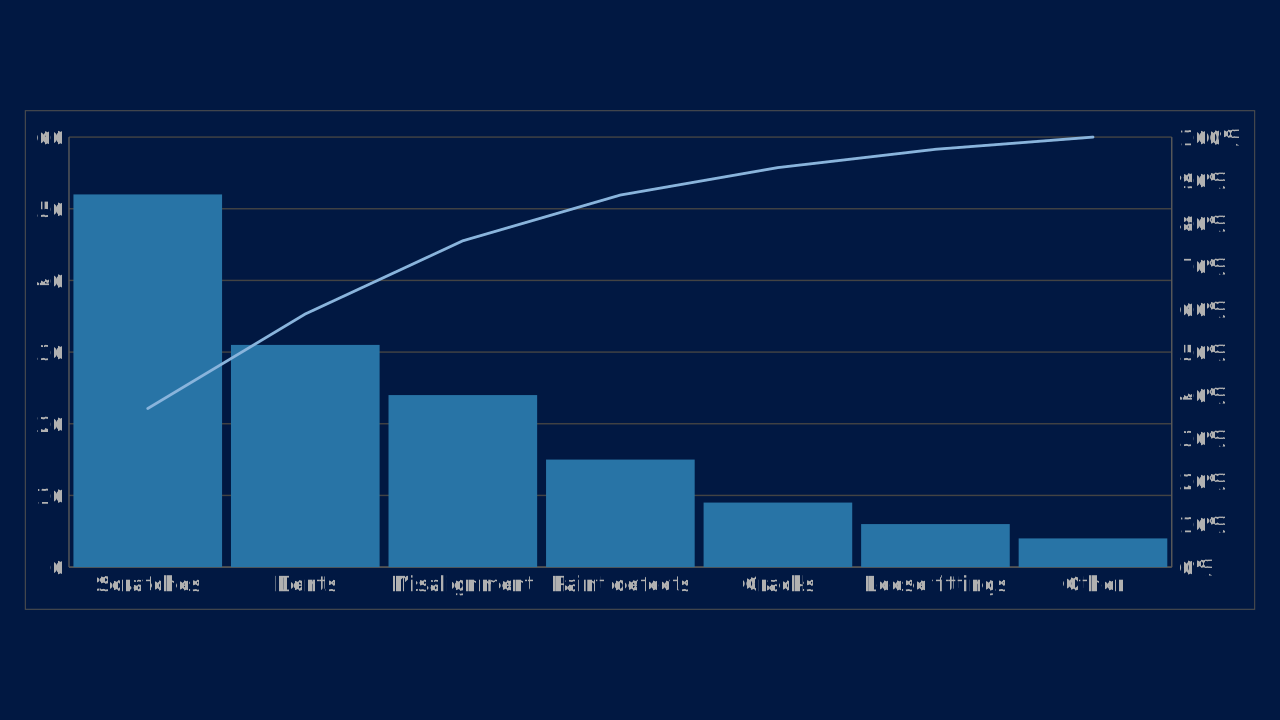
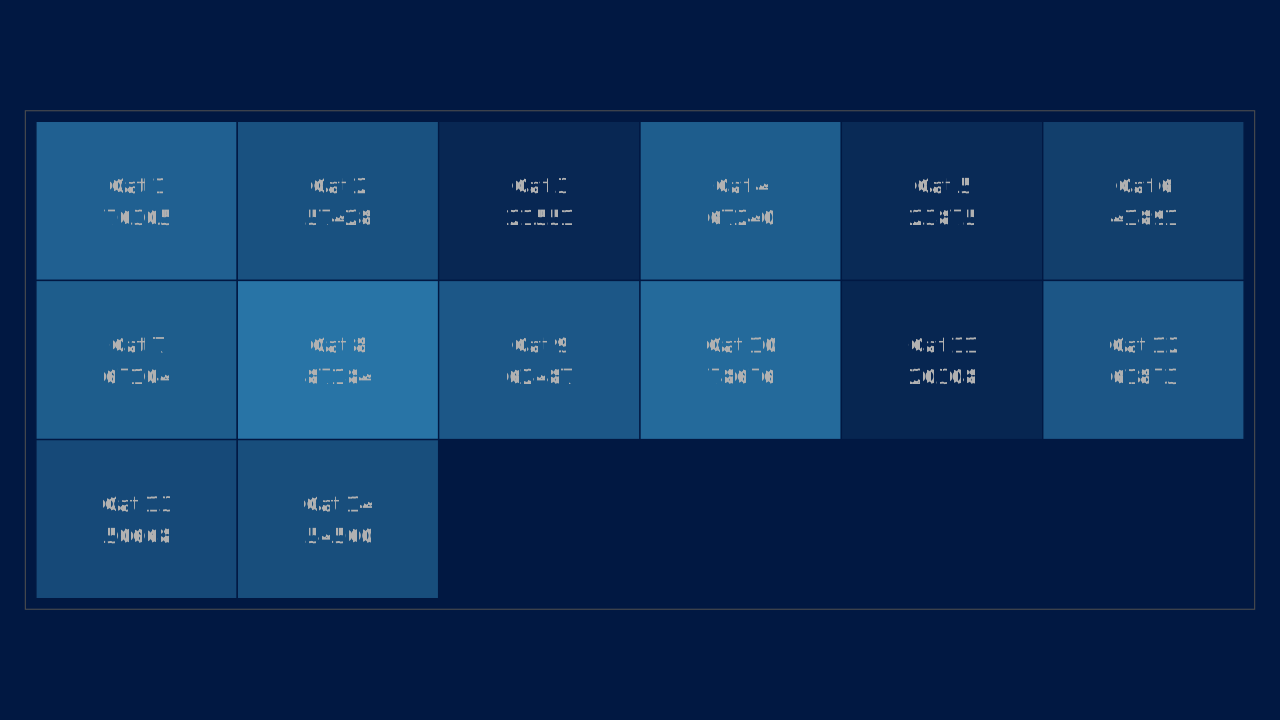
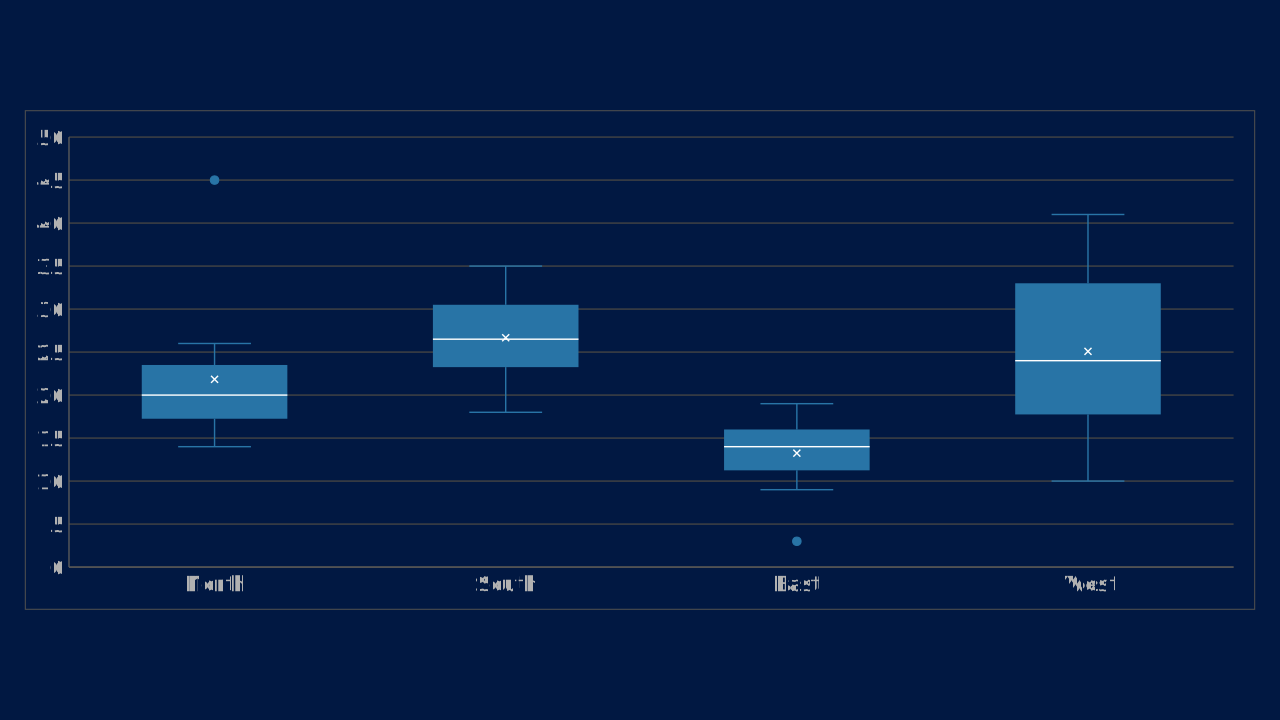
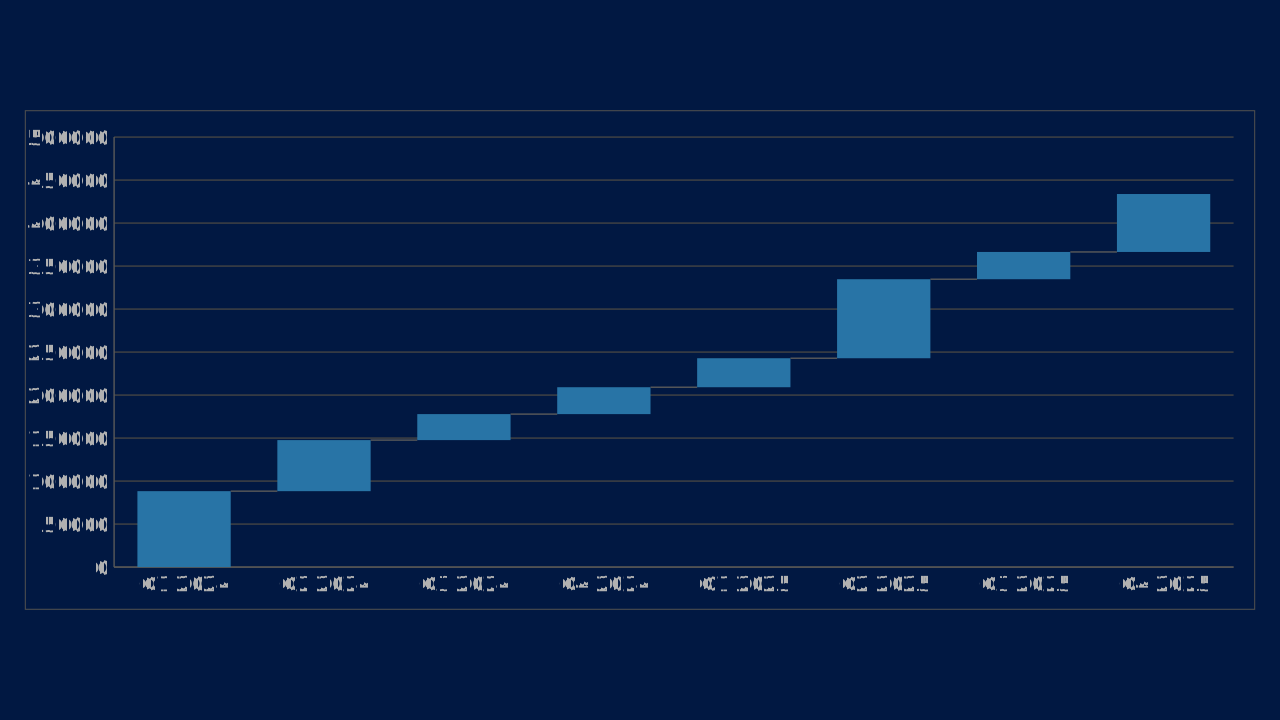
Treemap, histogram, Pareto, box & whisker, waterfall, funnel, and map are Office chartex types; the current OPF PPTX exporter writes them as clustered column charts, and 100% stacked variants as stacked. Previews and exports for those types are approximations until the exporter emits native chartex.