Layout Pattern
Detailed Data Table
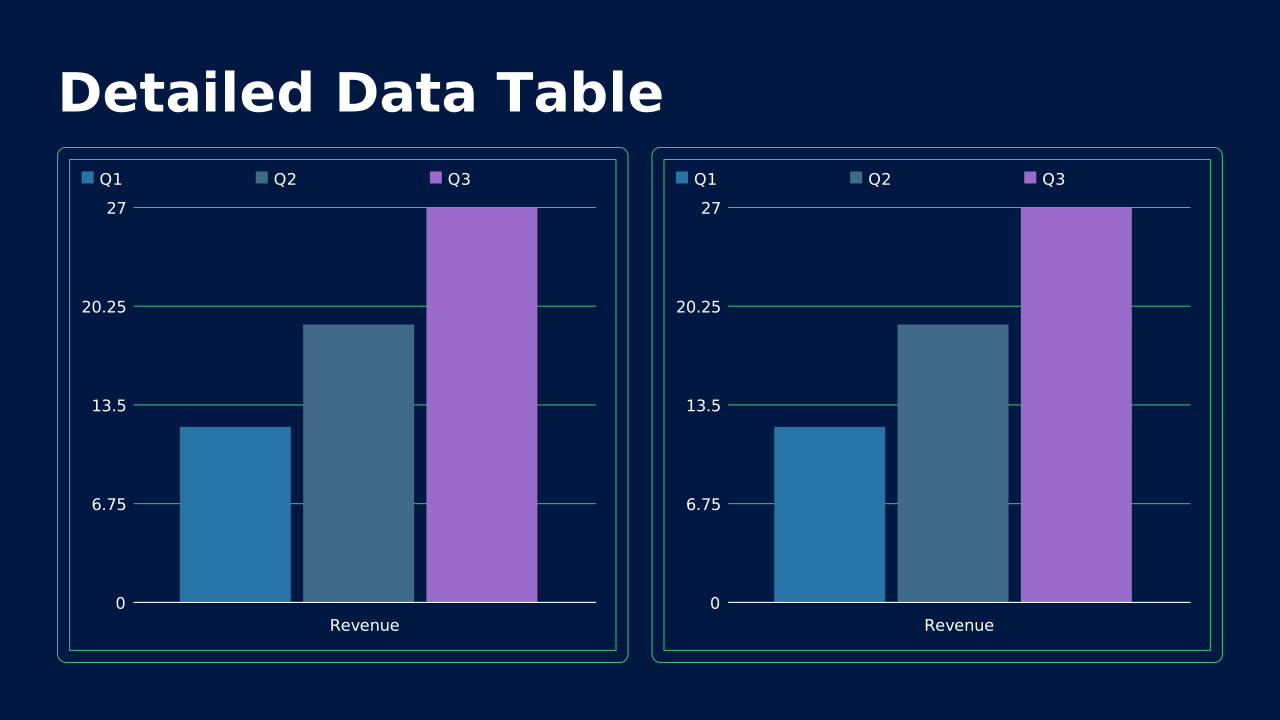
Full-slide data table for reference and Q&A. Dense on purpose, lives in the appendix.
How to Use It
Full-slide data table for reference and Q&A. Dense on purpose, lives in the appendix. OPF placeholders: title, chart, chart.
Content Zones
Try dynamic composition
Explore how a text slide reflows as you change its content and shape. These examples use OPF’s shared composition rules; the copied document includes your choices.
All sample text fits within its content areas.
View the complete OPF example
{
  "$schema": "https://openpresentation.org/schema/opf/v1",
  "name": "Dynamic composition example",
  "design": {
    "dimensions": {
      "widthInches": 13.333333333333334,
      "heightInches": 7.5
    }
  },
  "slides": [
    {
      "title": "Let the content find its space",
      "composition": {
        "mode": "auto"
      },
      "blocks": [
        {
          "text": "Start with the decision. State what the audience should understand or do."
        },
        {
          "text": "Show the evidence. Give each supporting idea enough space to be read."
        },
        {
          "text": "Make the next step clear. Keep the action specific and easy to remember."
        }
      ]
    }
  ]
}
Composition rules and examples as JSON · Pagination rules and example JSON
Related Layouts
Similar OPF layout slugs with matching content types, spatial patterns, or presentation use cases.
Data Analysis
Dashboard
Multiple small charts in a grid for an at-a-glance overview. Bird's-eye view of a business or function.
/layouts/dashboard
Data Analysis
Data Visualization
Clean charts and graphs with supporting text. Present complex data in digestible formats.
/layouts/data-visualization
Data Analysis
Forecast / Scenario Model
Multi-line chart showing base, upside, and downside projections. The honest way to present uncertainty.
/layouts/forecast-scenario
Data Analysis
Waterfall / Bridge
Step chart showing how a starting value becomes an ending value. Makes variances and drivers legible.
/layouts/waterfall-bridge
Data Evidence
Chart 2x SlideImage
Chart 2x SlideImage OPF layout with 2 chart zones.
/layouts/chart-2x-slideimage
Data Evidence
Chart 2x Title Center
Chart 2x Title Center OPF layout with 2 chart zones and a slide title.
/layouts/chart-2x-title-center
OPF Config
layouts:detailed-data-table{
"$schema": "https://openpresentation.org/schema/opf/v1",
"name": "PPTX.gallery — layouts/detailed-data-table",
"tags": [
"gallery:layouts/detailed-data-table"
],
"slides": [
{
"id": "gallery-preview-1",
"layout": "detailed-data-table",
"title": "Detailed Data Table",
"blocks": [
{
"chart": {
"type": "column",
"data": {
"columns": [
"Series",
"Q1",
"Q2",
"Q3"
],
"rows": [
[
"Revenue",
12,
19,
27
]
]
}
}
},
{
"chart": {
"type": "column",
"data": {
"columns": [
"Series",
"Q1",
"Q2",
"Q3"
],
"rows": [
[
"Revenue",
12,
19,
27
]
]
}
}
}
],
"design": {
"contentBox": true,
"contentAlignment": "left",
"titleAlignment": "left",
"contentDirection": "horizontal"
}
}
],
"catalogs": {
"layouts": {
"records": [
{
"$schema": "https://openpresentation.org/schema/opf-layout/v1",
"id": "detailed-data-table",
"name": "Detailed_Data_Table",
"label": "Detailed Data Table",
"summary": "Full-slide data table for reference and Q&A. Dense on purpose, lives in the appendix.",
"description": "Full-slide data table for reference and Q&A. Dense on purpose, lives in the appendix.",
"tags": [
"Data",
"Table",
"Reference"
],
"master": "Gallery",
"masterSlideIndex": 69,
"groupHash": "45ed394b70204041a80698b51480dba3baf1a214ffb3ca11e841f78e2c5565a5",
"groupDefault": true,
"contentType": "Chart",
"contentMultiple": "2x",
"contentAlignment": "Left",
"contentBox": true,
"contentTypeChartPrimary": "None",
"contentTypeImageFill": "None",
"contentTypeListBullet": "None",
"contentTypeListHeading": false,
"slideTitle": true,
"slideTitleAlignment": "Left",
"slideImage": false,
"slideImageAlignment": "None",
"slideLayoutDirection": "Horizontal",
"zones": [
{
"role": "title",
"placeholder": "title"
},
{
"role": "chart",
"placeholder": "chart content 2"
},
{
"role": "chart",
"placeholder": "chart content 3"
}
],
"preview": {},
"details": "Full-slide data table for reference and Q&A. Dense on purpose, lives in the appendix. OPF placeholders: title, chart, chart.",
"category": "data-analysis",
"spatialCategory": "2 zone row",
"contentTypeTags": [
"comparison",
"mixed",
"chart"
],
"placeholders": [
{
"type": "title"
},
{
"type": "chart"
},
{
"type": "chart"
}
],
"composition": {
"mode": "row"
},
"slideSubtitle": false
}
]
}
}
}Preview this config live at pptx.dev/playground, or load it in the gallery visual editor.