Layout Pattern
Feature Comparison Matrix
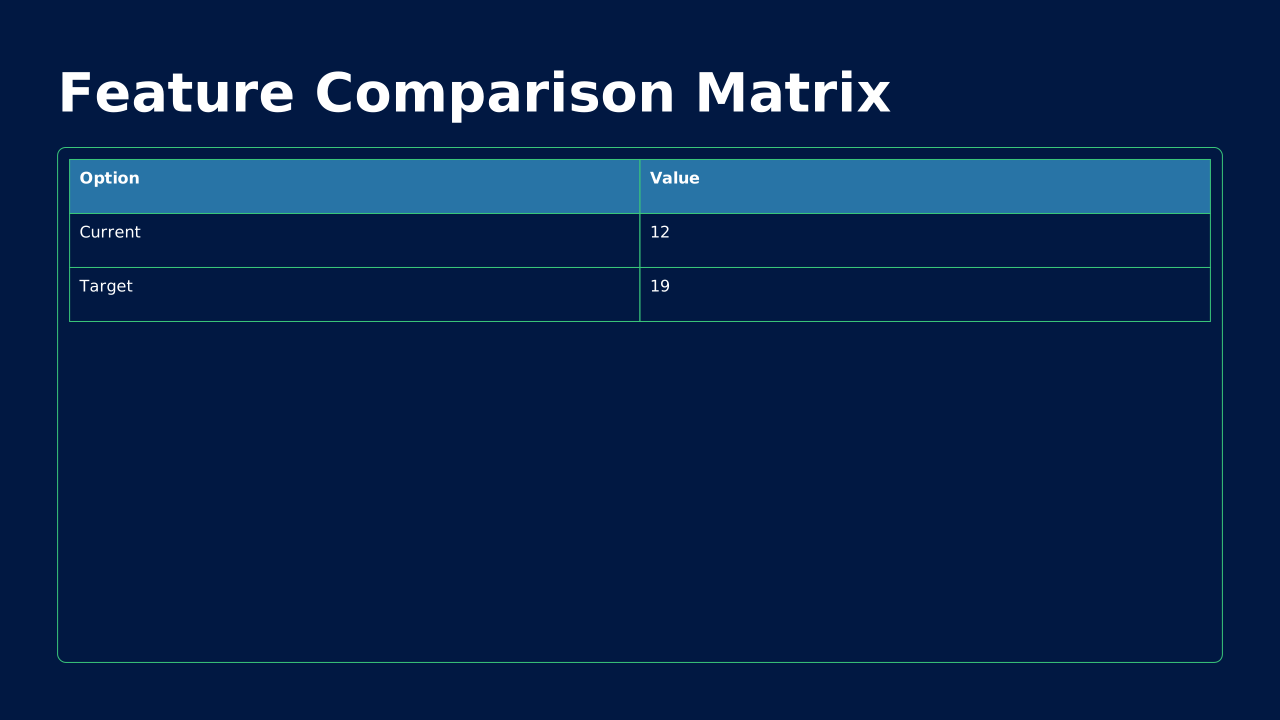
Rows of features vs. columns of options with check/X marks. The no-argument way to show what wins on paper.
How to Use It
Rows of features vs. columns of options with check/X marks. The no-argument way to show what wins on paper. OPF placeholders: title, table.
Content Zones
Try dynamic composition
Explore how a text slide reflows as you change its content and shape. These examples use OPF’s shared composition rules; the copied document includes your choices.
All sample text fits within its content areas.
View the complete OPF example
{
  "$schema": "https://openpresentation.org/schema/opf/v1",
  "name": "Dynamic composition example",
  "design": {
    "dimensions": {
      "widthInches": 13.333333333333334,
      "heightInches": 7.5
    }
  },
  "slides": [
    {
      "title": "Let the content find its space",
      "composition": {
        "mode": "auto"
      },
      "blocks": [
        {
          "text": "Start with the decision. State what the audience should understand or do."
        },
        {
          "text": "Show the evidence. Give each supporting idea enough space to be read."
        },
        {
          "text": "Make the next step clear. Keep the action specific and easy to remember."
        }
      ]
    }
  ]
}
Composition rules and examples as JSON · Pagination rules and example JSON
Related Layouts
Similar OPF layout slugs with matching content types, spatial patterns, or presentation use cases.
Data Analysis
Benchmark / Target Table
Table comparing our metric to industry benchmarks or internal targets. Context that raw numbers lack.
/layouts/benchmark-target-table
Business Strategic
Pricing Table
Tiered options in columns with feature comparisons. Makes your offering and value tiers crystal clear.
/layouts/pricing-table
Data Analysis
Decision Tree
Branching diagram showing choices and consequences. Makes decision logic visual and transparent.
/layouts/decision-tree
Data Analysis
Funnel / Pyramid
Tapered shape showing progression, conversion, or hierarchy. Visualizes stages, filtering, or organizational levels.
/layouts/funnel-pyramid
Data Analysis
Geographic Map
Map-based visualization of regions, territories, or location-based data. Turns spreadsheets into geography.
/layouts/geographic-map
Data Analysis
Heatmap / Cohort Grid
Color-intensity grid showing patterns across two dimensions. Surfaces trends that tables hide.
/layouts/heatmap-cohort
OPF Config
layouts:feature-comparison-matrix{
"$schema": "https://openpresentation.org/schema/opf/v1",
"name": "PPTX.gallery — layouts/feature-comparison-matrix",
"tags": [
"gallery:layouts/feature-comparison-matrix"
],
"slides": [
{
"id": "gallery-preview-1",
"layout": "feature-comparison-matrix",
"title": "Feature Comparison Matrix",
"table": {
"columns": [
"Option",
"Value"
],
"rows": [
[
"Current",
"12"
],
[
"Target",
"19"
]
]
},
"design": {
"contentBox": true,
"contentAlignment": "left",
"titleAlignment": "left",
"contentDirection": "horizontal"
}
}
],
"catalogs": {
"layouts": {
"records": [
{
"$schema": "https://openpresentation.org/schema/opf-layout/v1",
"id": "feature-comparison-matrix",
"name": "Feature_Comparison_Matrix",
"label": "Feature Comparison Matrix",
"summary": "Rows of features vs. columns of options with check/X marks. The no-argument way to show what wins on paper.",
"description": "Rows of features vs. columns of options with check/X marks. The no-argument way to show what wins on paper.",
"tags": [
"Comparison",
"Matrix",
"Evaluation"
],
"master": "Gallery",
"masterSlideIndex": 34,
"groupHash": "c1fc5059c5e774fd4b107c587340efc437d29df76535a45f067fe82cf7528f6d",
"groupDefault": true,
"contentType": "Table",
"contentMultiple": "1x",
"contentAlignment": "Left",
"contentBox": true,
"contentTypeChartPrimary": "None",
"contentTypeImageFill": "None",
"contentTypeListBullet": "None",
"contentTypeListHeading": false,
"slideTitle": true,
"slideTitleAlignment": "Left",
"slideImage": false,
"slideImageAlignment": "None",
"slideLayoutDirection": "Horizontal",
"zones": [
{
"role": "title",
"placeholder": "title"
},
{
"role": "table",
"placeholder": "table content 2"
}
],
"preview": {},
"details": "Rows of features vs. columns of options with check/X marks. The no-argument way to show what wins on paper. OPF placeholders: title, table.",
"category": "data-analysis",
"spatialCategory": "single zone",
"contentTypeTags": [
"comparison",
"mixed",
"table"
],
"placeholders": [
{
"type": "title"
},
{
"type": "table"
}
],
"slideSubtitle": false
}
]
}
}
}Preview this config live at pptx.dev/playground, or load it in the gallery visual editor.