Combo Chart Preset
Combo: Column and Line
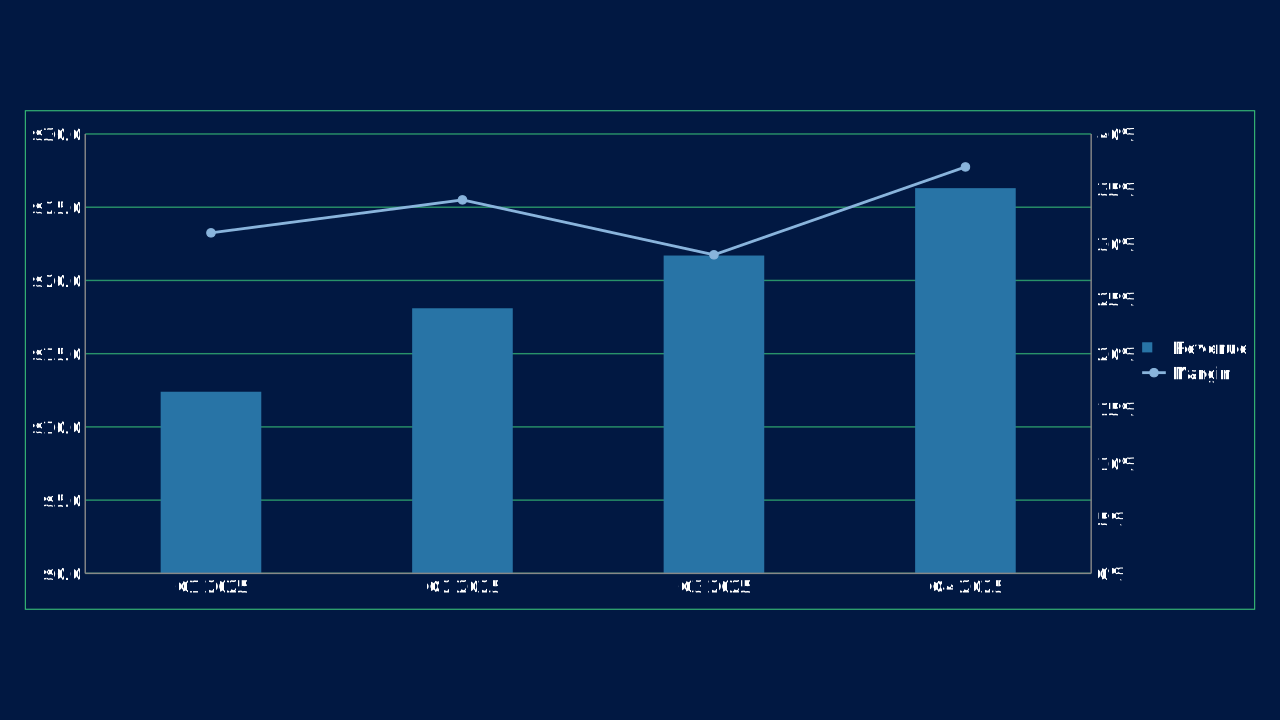
Combo: Column and Line is an OPF combo chart preset: clustered columns with a line series, the line on a secondary value axis in its own number format.
Use Case
Show an amount and a rate for the same categories, such as revenue and margin by quarter.
Data Requirements
2 or more series, 4 categories; the last series (or the ones chart.line names) is drawn as a line, chart.secondaryAxis moves it to a right-hand axis
Group
Combo
Series
2 series across 4 categories
Workbook Range
Sheet1!$A$1:$E$3
When to Use
Use when two measures share the categories but not the unit, so one value axis would flatten the smaller measure.
When to Avoid
Avoid when both measures share a unit and scale (use a clustered column or line chart), or when more than one or two lines would crowd the columns.
Best Practices
Put the rate on the secondary axis and give it a percent format
Title both value axes
Keep one or two line series
Recommended Companions
OPF Config
charts:combo{
"$schema": "https://openpresentation.org/schema/opf/v1",
"name": "PPTX.gallery — charts/combo",
"description": "Combo: Column and Line is an OPF combo chart preset: clustered columns with a line series, the line on a secondary value axis in its own number format.",
"tags": [
"gallery:charts/combo"
],
"slides": [
{
"id": "gallery-preview-1",
"layout": "data-visualization",
"title": "Combo: Column and Line",
"subtitle": "Show an amount and a rate for the same categories, such as revenue and margin by quarter.",
"chart": {
"type": "combo",
"data": {
"columns": [
"Category",
{
"name": "Revenue",
"format": "$#,##0.0"
},
{
"name": "Margin",
"format": "0%"
}
],
"rows": [
[
"Q1 2025",
12.4,
0.31
],
[
"Q2 2025",
18.1,
0.34
],
[
"Q3 2025",
21.7,
0.29
],
[
"Q4 2025",
26.3,
0.37
]
]
},
"line": [
"Margin"
],
"secondaryAxis": [
"Margin"
]
},
"design": {
"contentBox": false,
"contentAlignment": "left",
"titleAlignment": "left",
"contentDirection": "horizontal"
}
}
]
}Load this config in the gallery's visual editor, or in the Inspector at pptx.dev.