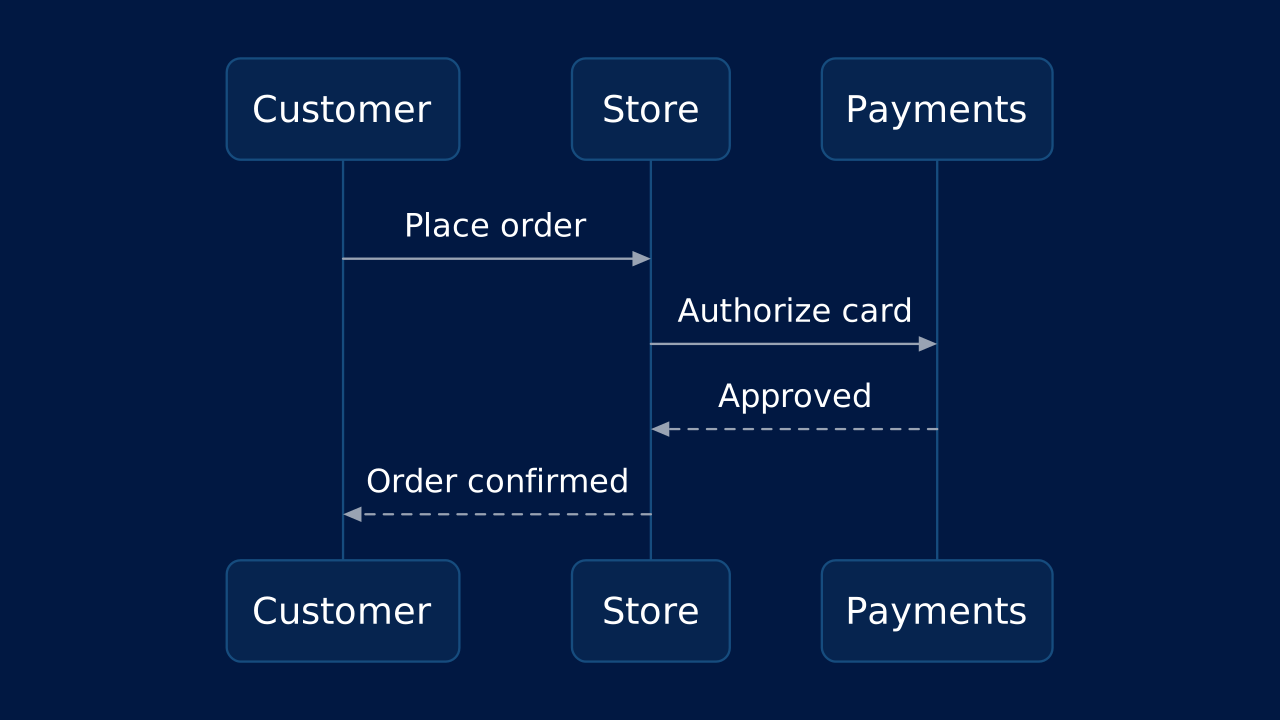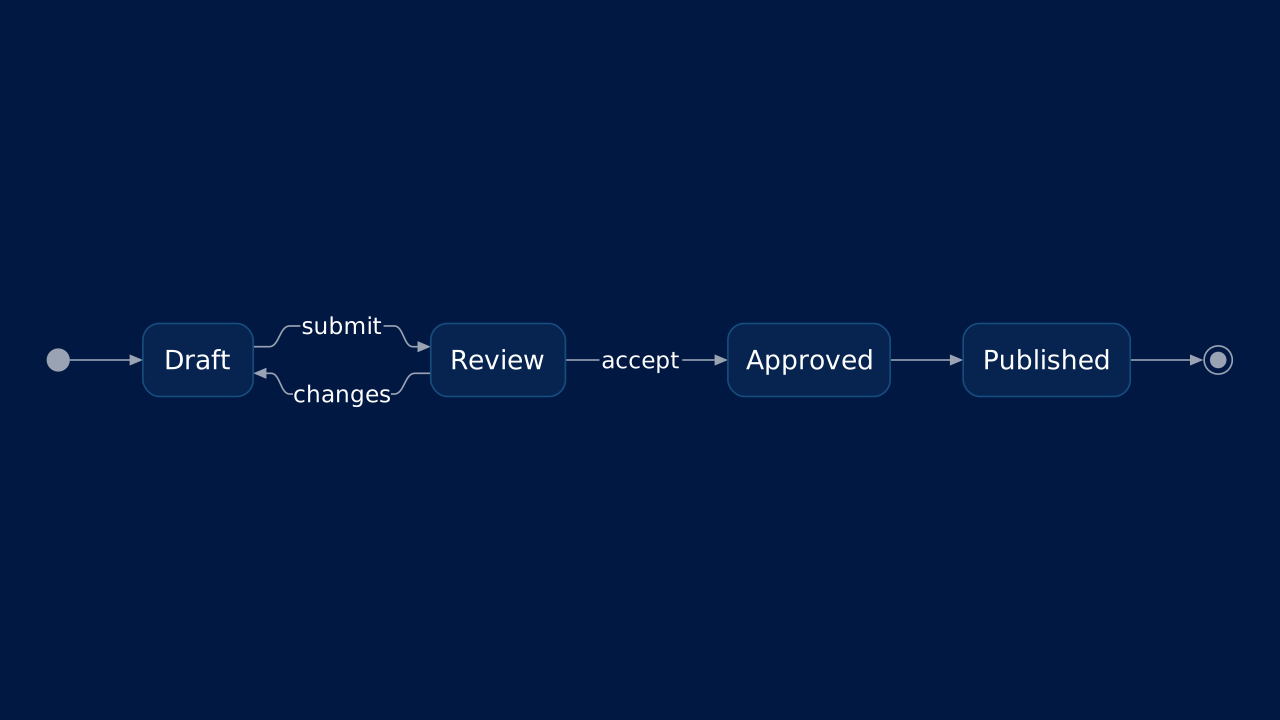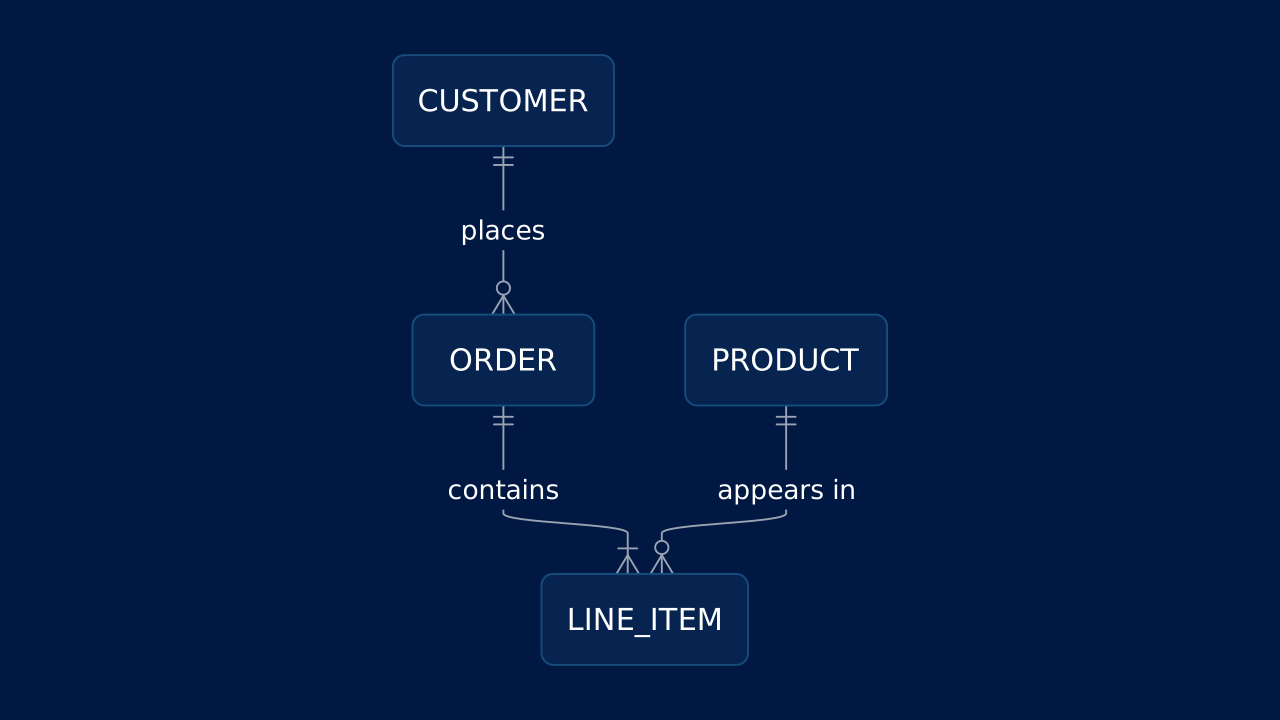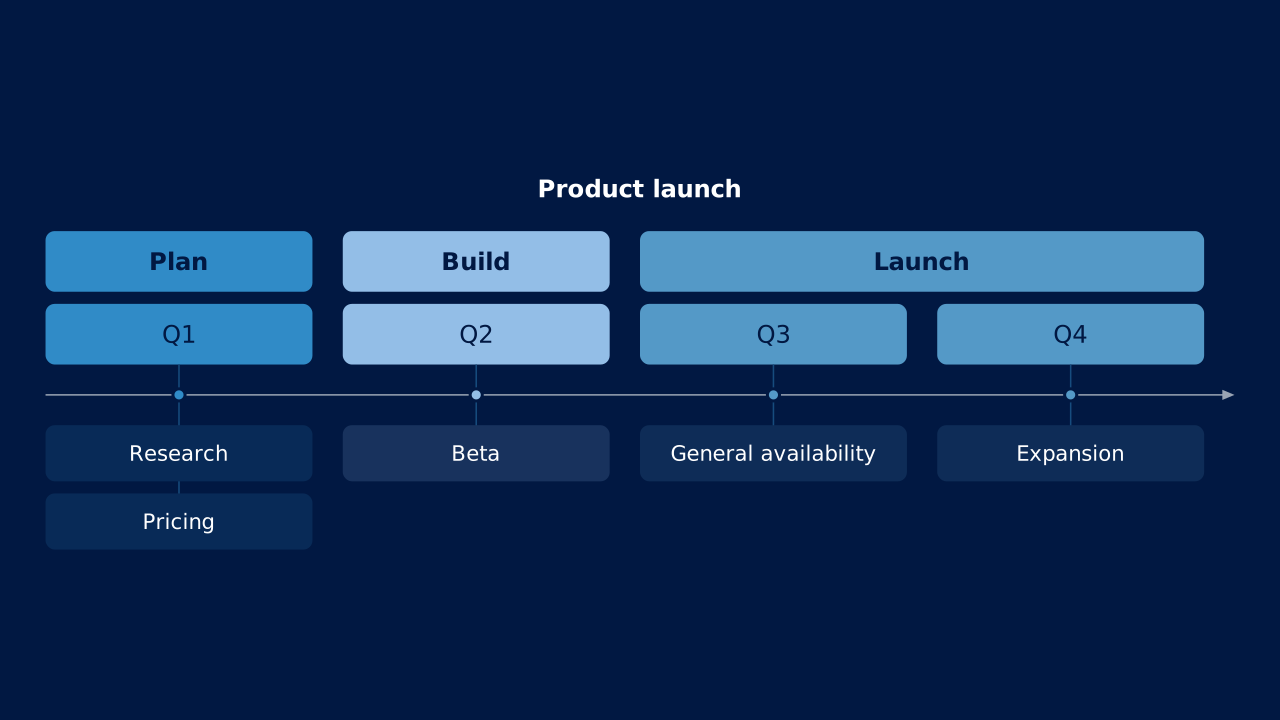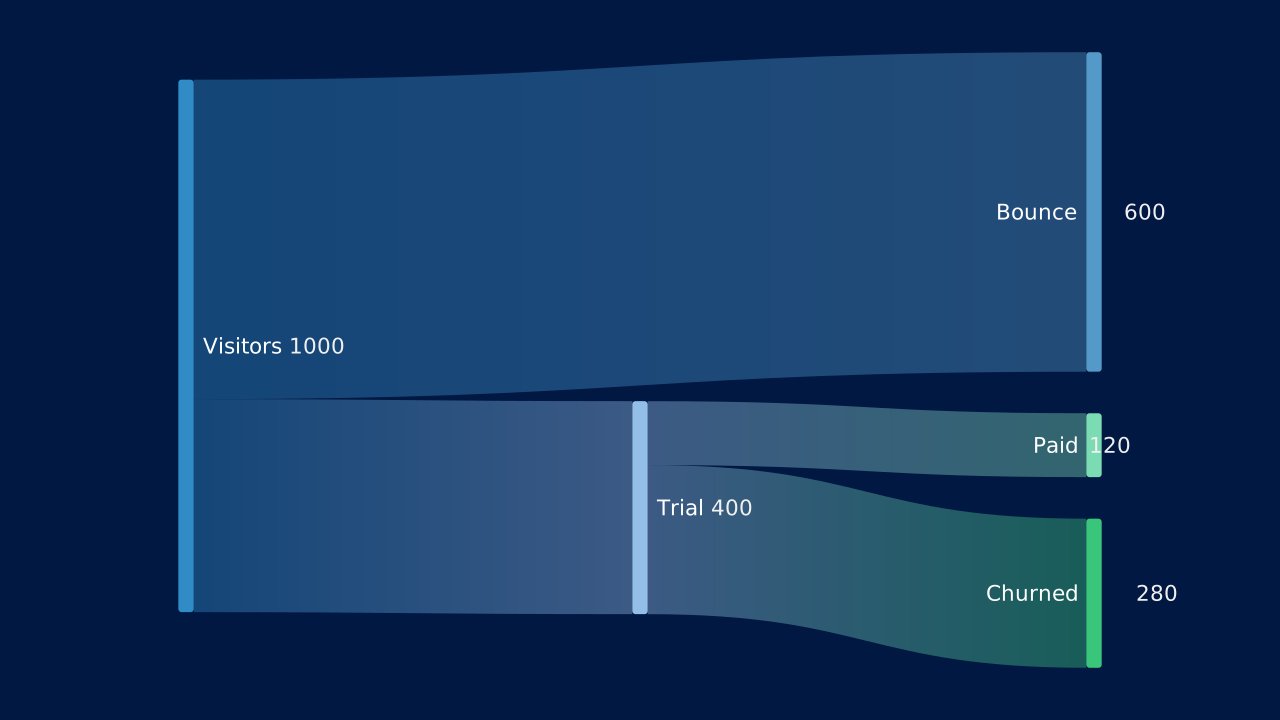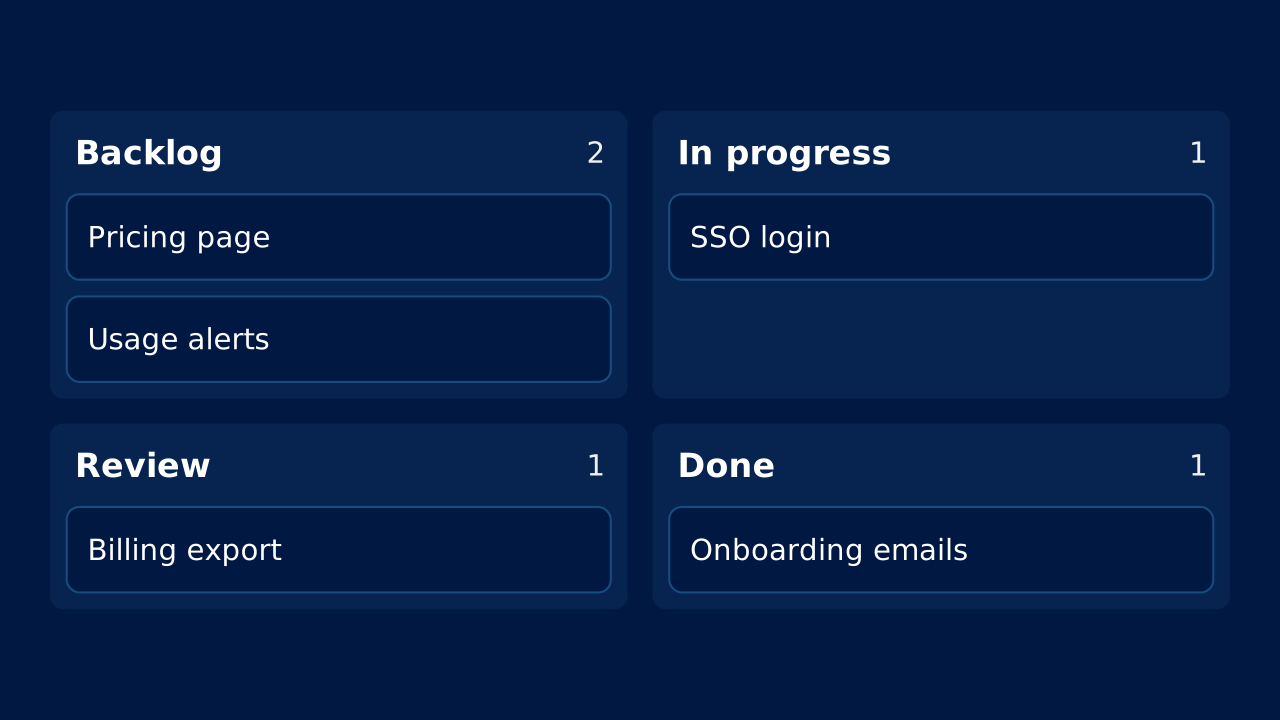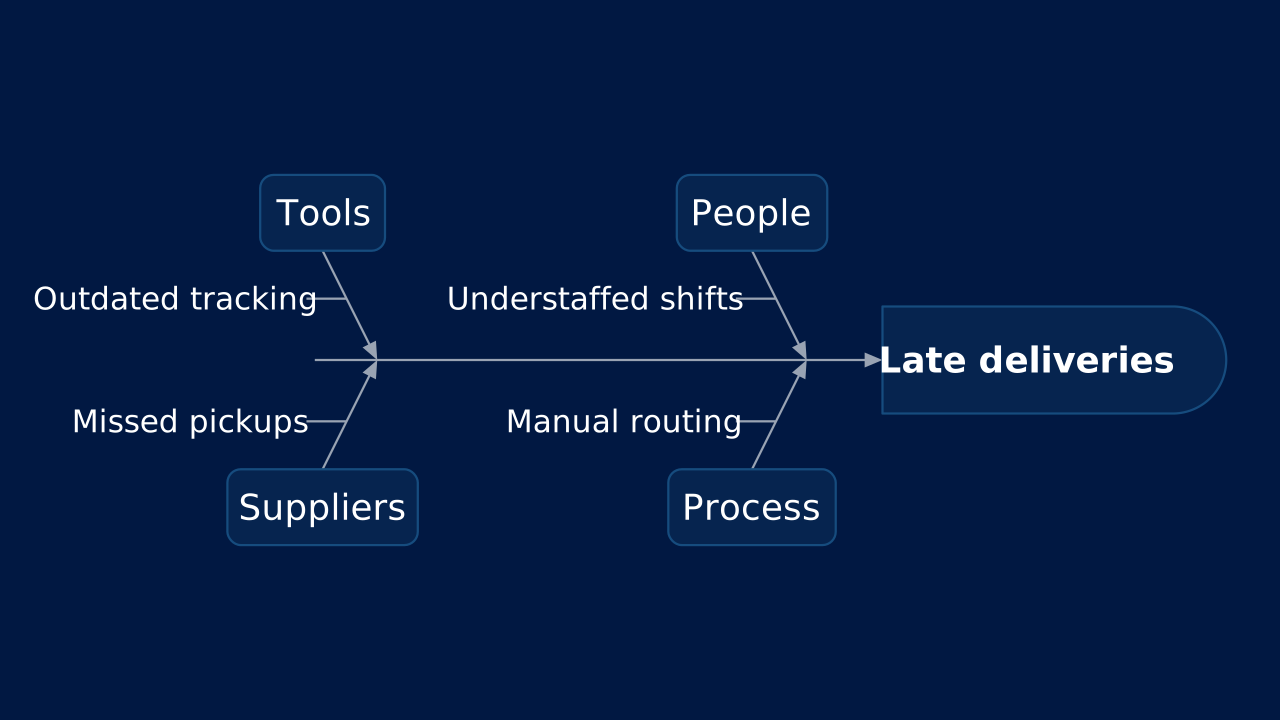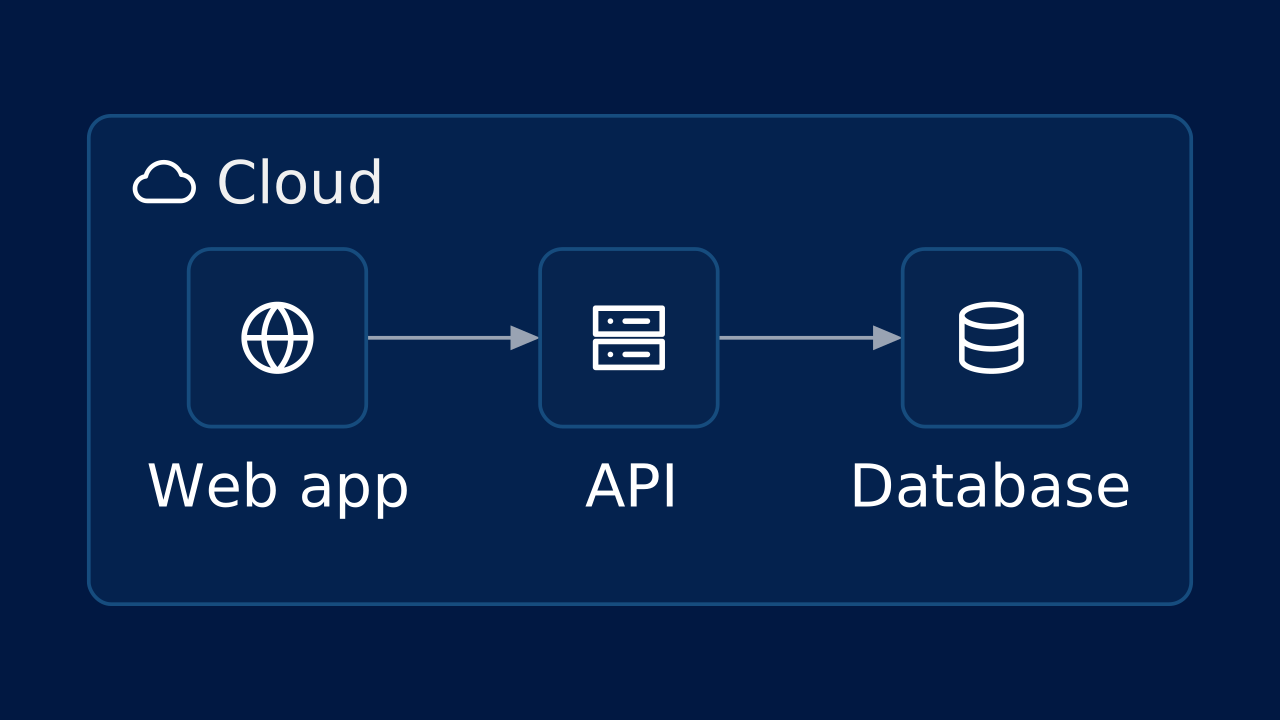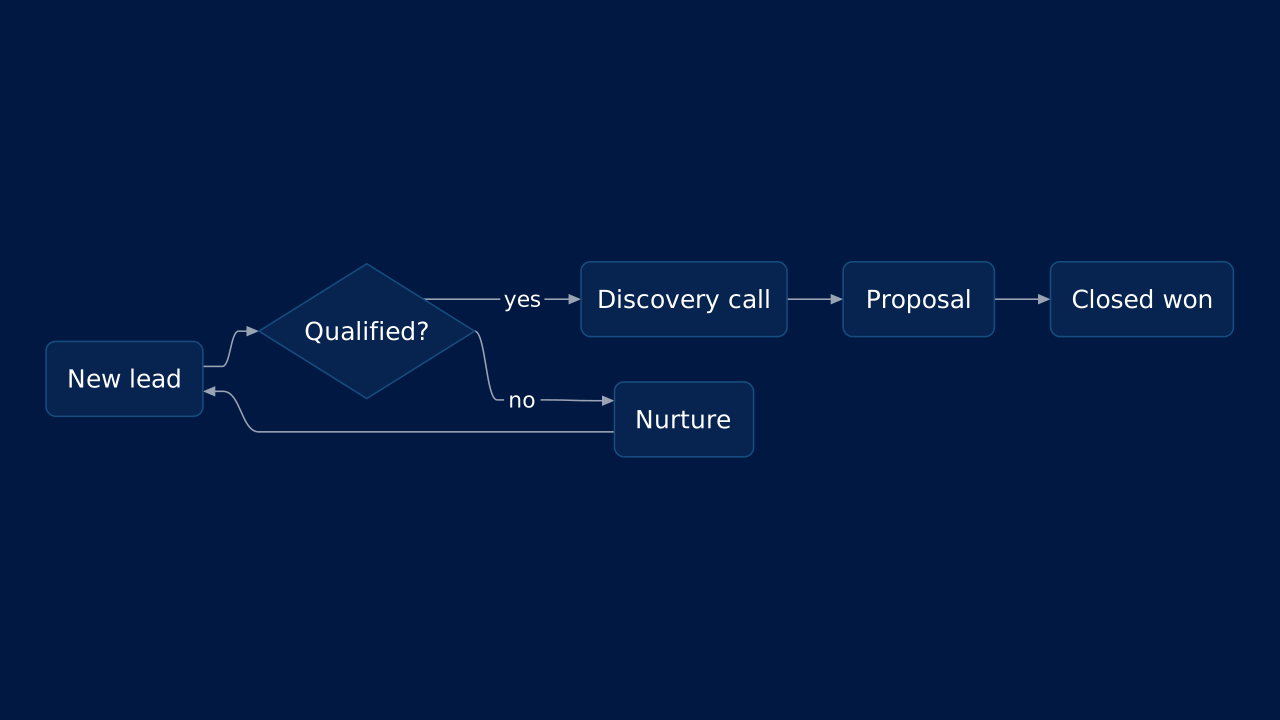
Flowchart
Use a flowchart to show the steps and decisions of a process, such as how a lead moves through a sales pipeline.
flowchart
Diagrams
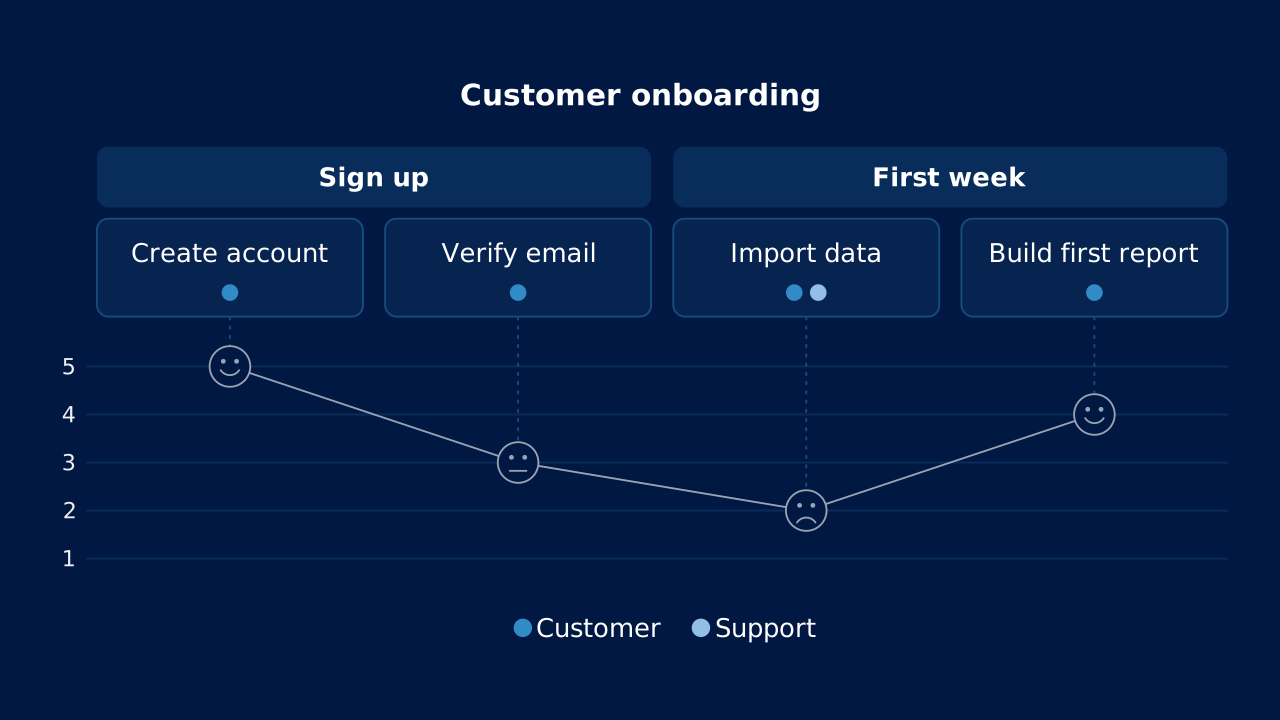
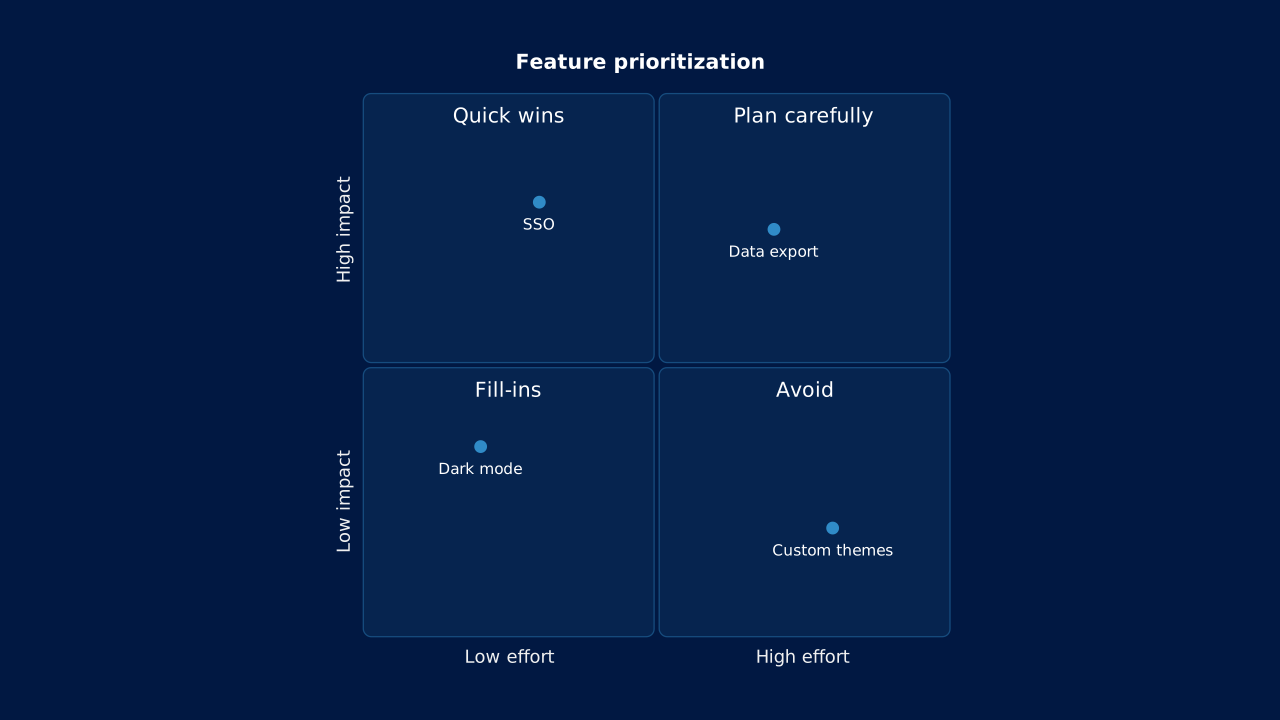
A diagram is an OPF content kind written as text: Mermaid source in a slide's diagram field. The engines draw it in the deck's own fonts and colors, so a flowchart or a mind map looks like the rest of the slide, not like a pasted screenshot.
Tints of the first accent of the slide's color scheme, in the slide variant's order, mixed over the surface the diagram sits on: its card, else the slide background.
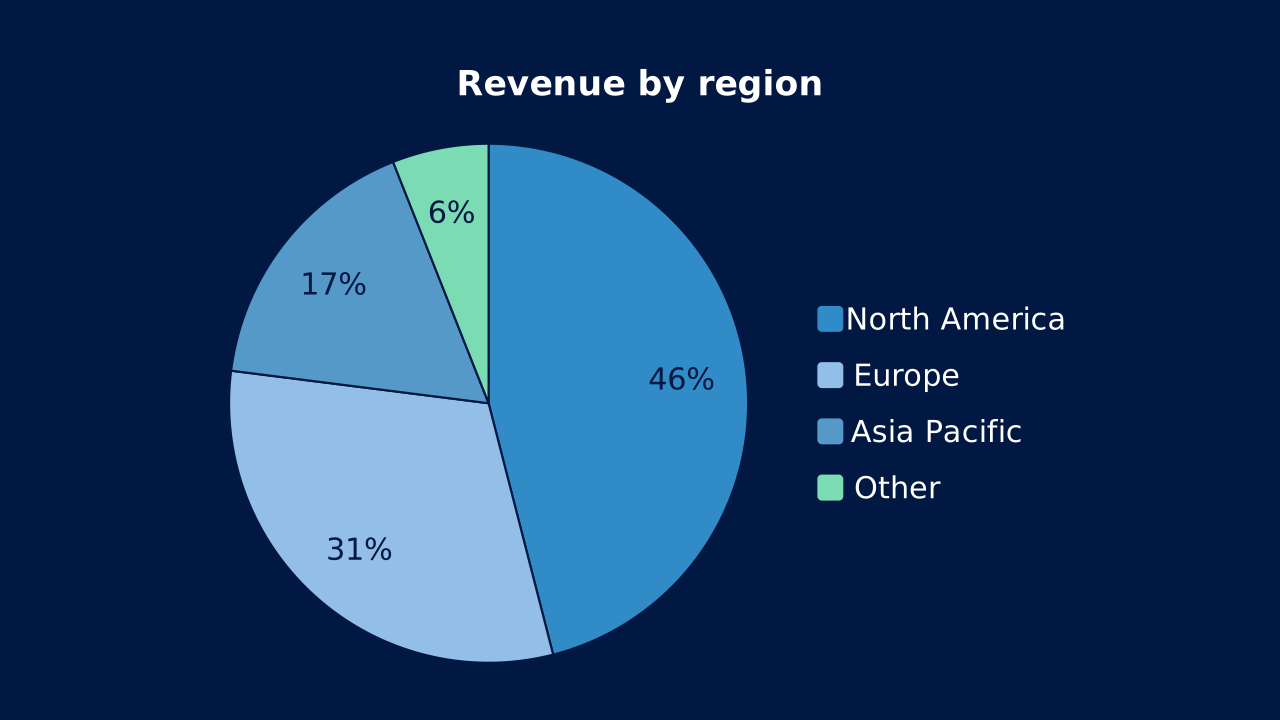
Pie slices, sections, branches and series take the chart series palette: the color scheme's accents in the variant's order, as the slide's charts do.
Labels use the font scheme's body font, code-like labels its code font, and keep 4.5:1 contrast against their fill.
A dark background, a dark variant or a color map redraws the same source from the dark surface, with no change to the diagram.
Mermaid's own theming is ignored. Authored style and classDef colors are kept, but a shape with an authored color no longer follows the deck: leave them out and let the color scheme decide.
A layout region lists the content kinds it accepts. In the default catalog these regions accept diagram; a slide with no layout composes a diagram automatically.
Give every diagram an alt that states what it shows, not that it is a diagram. Without one, engines derive a text alternative from the diagram type and its labels.
Leave out Mermaid style, classDef and init theming: OPF draws the diagram from the slide's color scheme, font scheme and variant. An authored color no longer follows the deck.
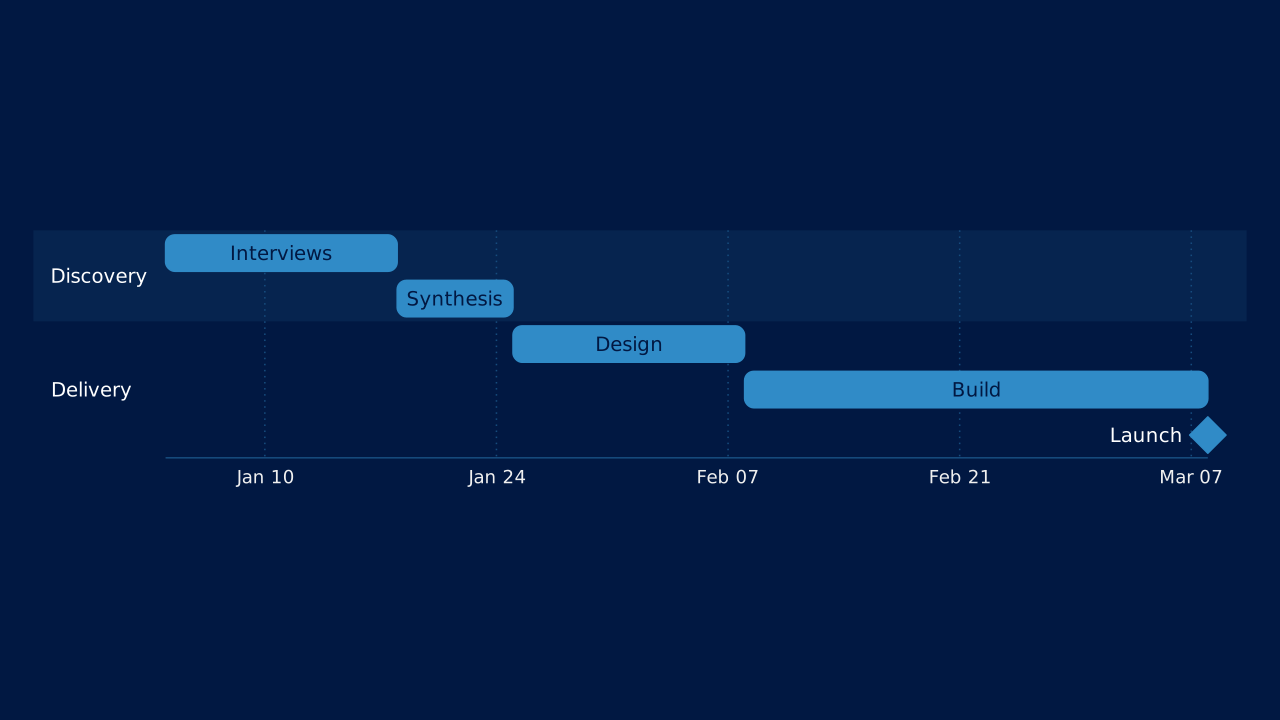
A chart or timeline payload keeps the data editable and gets the chart and timeline design. Use a diagram when only a diagram can show the structure.
Short labels and one idea per diagram. When a diagram does not fit, give it its own slide or region, turn its direction (LR to TB) or split it in two.