Area Chart Preset
Stacked Area
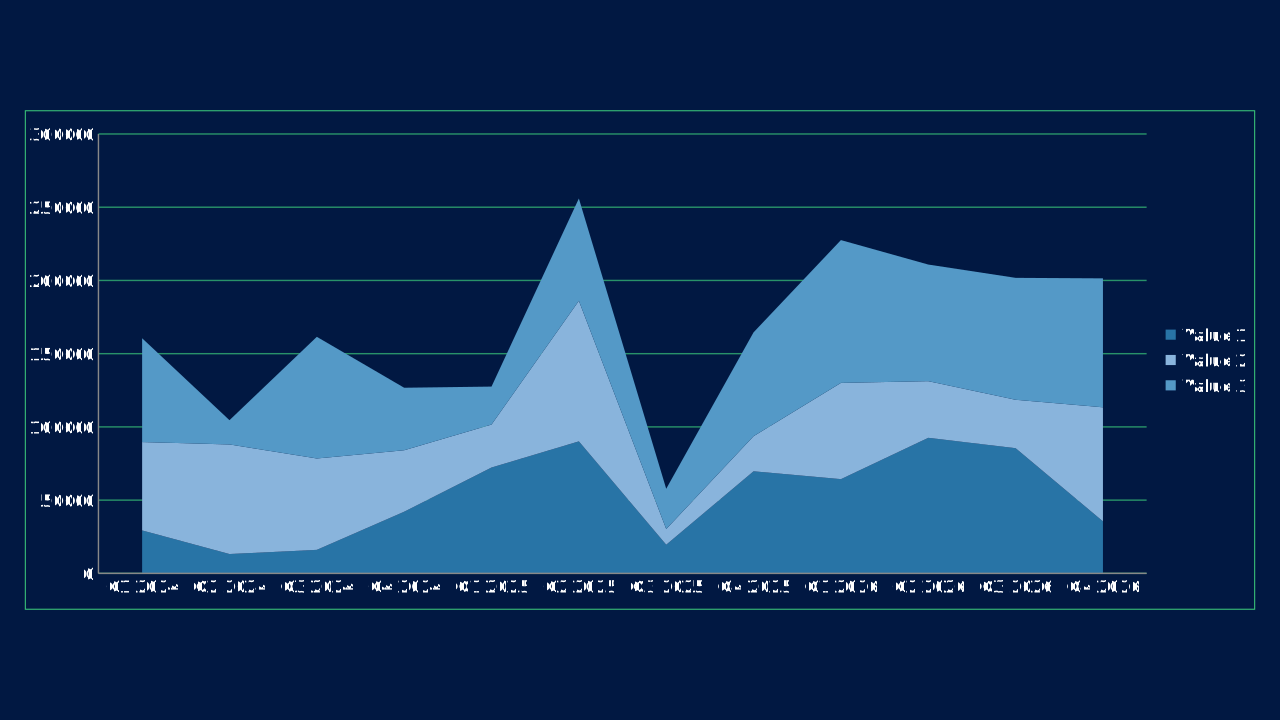
Stacked Area is an OPF area chart preset with canonical workbook metadata, sample data, and engine chart type mapping.
stacked-areaOPF type: STACKED_AREAsimple
Use Case
Show trend direction while giving visual weight to magnitude or contribution.
Data Requirements
3 series, 12 categories, flat category/series workbook
Group
Filled trend charts that emphasize volume, accumulation, or composition over time.
Series
3 series across 12 categories
Workbook Range
Sheet1!$A$1:$M$4
When to Use
Use when cumulative volume or segment contribution is part of the argument.
When to Avoid
Avoid when overlapping areas hide exact values or when many series compete.
Best Practices
1
Use transparency deliberately
2
Keep stacking order stable
3
Reserve heavy fills for high-level stories
Recommended Companions
OPF Config
charts:stacked-areaOpen Presentation Format
{
  "$schema": "https://openpresentation.org/schema/opf/v1",
  "name": "PPTX.gallery — charts/stacked-area",
  "description": "Stacked Area is an OPF area chart preset with canonical workbook metadata, sample data, and engine chart type mapping.",
  "tags": [
    "gallery:charts/stacked-area"
  ],
  "slides": [
    {
      "id": "gallery-preview-1",
      "layout": "data-visualization",
      "title": "Stacked Area",
      "subtitle": "Show trend direction while giving visual weight to magnitude or contribution.",
      "chart": {
        "type": "stacked-area",
        "data": {
          "columns": [
            "Category",
            "Value 1",
            "Value 2",
            "Value 3"
          ],
          "rows": [
            [
              "Q1 2024",
              29313,
              60328,
              70889
            ],
            [
              "Q2 2024",
              13201,
              74799,
              16582
            ],
            [
              "Q3 2024",
              16057,
              62383,
              83060
            ],
            [
              "Q4 2024",
              42092,
              41979,
              42662
            ],
            [
              "Q1 2025",
              72277,
              29342,
              25906
            ],
            [
              "Q2 2025",
              90120,
              95990,
              69829
            ],
            [
              "Q3 2025",
              19545,
              10726,
              27477
            ],
            [
              "Q4 2025",
              69692,
              23970,
              70901
            ],
            [
              "Q1 2026",
              64321,
              65724,
              97500
            ],
            [
              "Q2 2026",
              92544,
              38683,
              79616
            ],
            [
              "Q3 2026",
              85454,
              33053,
              83259
            ],
            [
              "Q4 2026",
              35485,
              77889,
              88047
            ]
          ]
        }
      },
      "design": {
        "contentBox": false,
        "contentAlignment": "left",
        "titleAlignment": "left",
        "contentDirection": "horizontal"
      }
    }
  ]
}
Open in visual editorOpen in Inspector
Load this config in the gallery's visual editor, or in the Inspector at pptx.dev.