Bar Chart Preset
Stacked Bar
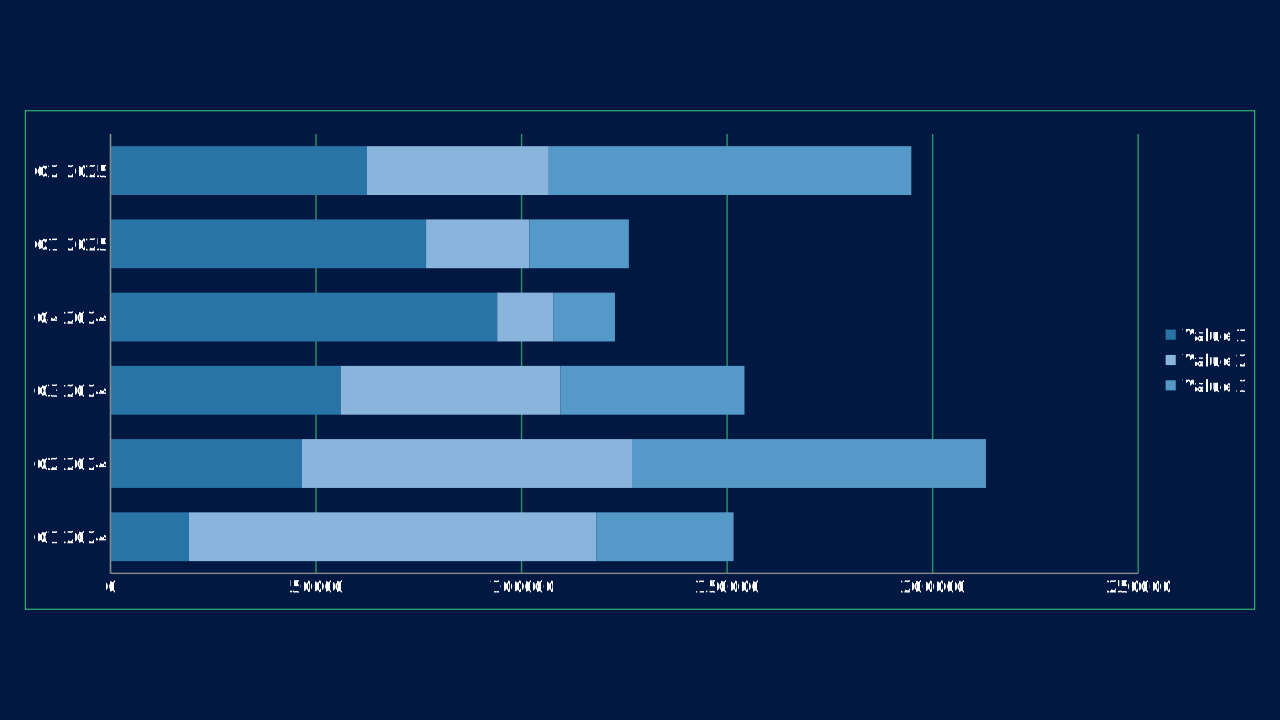
Stacked Bar is an OPF bar chart preset with canonical workbook metadata, sample data, and engine chart type mapping.
stacked-barOPF type: STACKED_BARsimple
Use Case
Rank or compare categories when horizontal labels need room.
Data Requirements
3 series, 6 categories, flat category/series workbook
Group
Horizontal comparisons, ranked values, and progress-style measures.
Series
3 series across 6 categories
Workbook Range
Sheet1!$A$1:$G$4
When to Use
Use when category names are long, ranking is the main story, or progress should read left to right.
When to Avoid
Avoid for dense time-series narratives where a line or area chart communicates direction better.
Best Practices
1
Sort bars by value when ranking
2
Use a single accent for the key item
3
Keep category labels readable
Recommended Companions
OPF Config
charts:stacked-barOpen Presentation Format
{
  "$schema": "https://openpresentation.org/schema/opf/v1",
  "name": "PPTX.gallery — charts/stacked-bar",
  "description": "Stacked Bar is an OPF bar chart preset with canonical workbook metadata, sample data, and engine chart type mapping.",
  "tags": [
    "gallery:charts/stacked-bar"
  ],
  "slides": [
    {
      "id": "gallery-preview-1",
      "layout": "data-visualization",
      "title": "Stacked Bar",
      "subtitle": "Rank or compare categories when horizontal labels need room.",
      "chart": {
        "type": "stacked-bar",
        "data": {
          "columns": [
            "Category",
            "Value 1",
            "Value 2",
            "Value 3"
          ],
          "rows": [
            [
              "Q1 2024",
              19099,
              99065,
              33405
            ],
            [
              "Q2 2024",
              46585,
              80282,
              86099
            ],
            [
              "Q3 2024",
              56025,
              53404,
              44795
            ],
            [
              "Q4 2024",
              94080,
              13617,
              15014
            ],
            [
              "Q1 2025",
              76768,
              25118,
              24208
            ],
            [
              "Q2 2025",
              62386,
              44237,
              88193
            ]
          ]
        }
      },
      "design": {
        "contentBox": false,
        "contentAlignment": "left",
        "titleAlignment": "left",
        "contentDirection": "horizontal"
      }
    }
  ]
}
Open in visual editorOpen in Inspector
Load this config in the gallery's visual editor, or in the Inspector at pptx.dev.