Column Chart Preset
Stacked Column
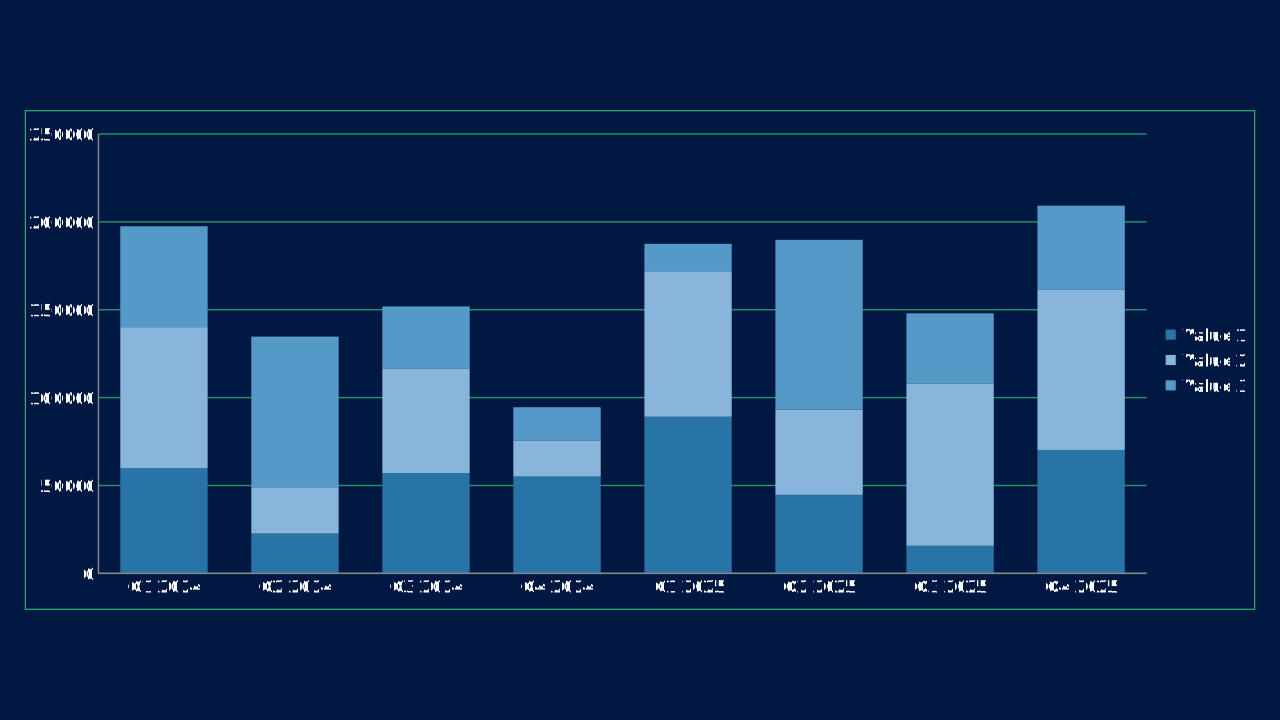
Stacked Column is an OPF column chart preset with canonical workbook metadata, sample data, and engine chart type mapping.
stacked-columnOPF type: STACKED_COLUMNsimple
Use Case
Compare category values in a familiar vertical format.
Data Requirements
3 series, 8 categories, flat category/series workbook
Group
Vertical comparisons across categories, time periods, or grouped series.
Series
3 series across 8 categories
Workbook Range
Sheet1!$A$1:$I$4
When to Use
Use when categories are short, sequence matters, or the audience expects a conventional business comparison.
When to Avoid
Avoid when labels are long or when too many series would make the columns visually dense.
Best Practices
1
Start the value axis at zero
2
Keep series counts modest
3
Label important values directly
Recommended Companions
OPF Config
charts:stacked-columnOpen Presentation Format
{
  "$schema": "https://openpresentation.org/schema/opf/v1",
  "name": "PPTX.gallery — charts/stacked-column",
  "description": "Stacked Column is an OPF column chart preset with canonical workbook metadata, sample data, and engine chart type mapping.",
  "tags": [
    "gallery:charts/stacked-column"
  ],
  "slides": [
    {
      "id": "gallery-preview-1",
      "layout": "data-visualization",
      "title": "Stacked Column",
      "subtitle": "Compare category values in a familiar vertical format.",
      "chart": {
        "type": "stacked-column",
        "data": {
          "columns": [
            "Category",
            "Value 1",
            "Value 2",
            "Value 3"
          ],
          "rows": [
            [
              "Q1 2024",
              59797,
              80284,
              57400
            ],
            [
              "Q2 2024",
              22676,
              26361,
              85674
            ],
            [
              "Q3 2024",
              57052,
              59615,
              35203
            ],
            [
              "Q4 2024",
              55082,
              20328,
              19116
            ],
            [
              "Q1 2025",
              89131,
              82357,
              16006
            ],
            [
              "Q2 2025",
              44671,
              48427,
              96673
            ],
            [
              "Q3 2025",
              15695,
              92397,
              39871
            ],
            [
              "Q4 2025",
              70217,
              91070,
              47930
            ]
          ]
        }
      },
      "design": {
        "contentBox": false,
        "contentAlignment": "left",
        "titleAlignment": "left",
        "contentDirection": "horizontal"
      }
    }
  ]
}
Open in visual editorOpen in Inspector
Load this config in the gallery's visual editor, or in the Inspector at pptx.dev.