Line Chart Preset
Stacked Line with Markers
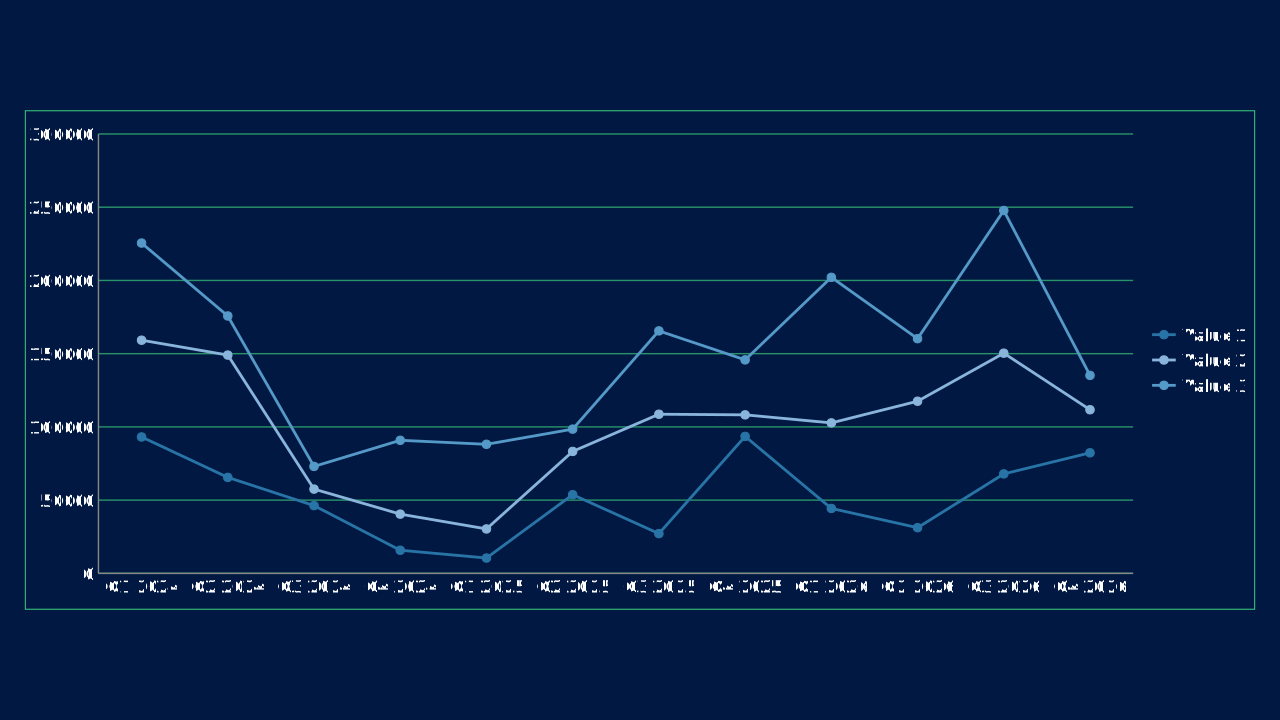
Stacked Line with Markers is an OPF line chart preset with canonical workbook metadata, sample data, and engine chart type mapping.
Use Case
Show how one or more metrics change over ordered categories or time.
Data Requirements
3 series, 12 categories, flat category/series workbook
Group
Trend charts for time-series movement and multi-series comparisons.
Series
3 series across 12 categories
Workbook Range
Sheet1!$A$1:$M$4
When to Use
Use for revenue, usage, retention, benchmarks, or any metric where direction matters more than isolated values.
When to Avoid
Avoid with unordered categories or when exact part-to-whole composition is the main message.
Best Practices
Keep line weights consistent
Direct-label series when possible
Use markers only when individual points matter
Recommended Companions
OPF Config
charts:stacked-line-with-markers{
"$schema": "https://openpresentation.org/schema/opf/v1",
"name": "PPTX.gallery — charts/stacked-line-with-markers",
"description": "Stacked Line with Markers is an OPF line chart preset with canonical workbook metadata, sample data, and engine chart type mapping.",
"tags": [
"gallery:charts/stacked-line-with-markers"
],
"slides": [
{
"id": "gallery-preview-1",
"layout": "data-visualization",
"title": "Stacked Line with Markers",
"subtitle": "Show how one or more metrics change over ordered categories or time.",
"chart": {
"type": "stacked-line-with-markers",
"data": {
"columns": [
"Category",
"Value 1",
"Value 2",
"Value 3"
],
"rows": [
[
"Q1 2024",
93136,
66057,
66333
],
[
"Q2 2024",
65518,
83519,
26704
],
[
"Q3 2024",
46265,
11267,
15482
],
[
"Q4 2024",
15778,
24663,
50404
],
[
"Q1 2025",
10464,
19862,
57795
],
[
"Q2 2025",
53719,
29536,
15229
],
[
"Q3 2025",
27146,
81511,
56898
],
[
"Q4 2025",
93507,
14722,
37535
],
[
"Q1 2026",
44335,
58393,
99399
],
[
"Q2 2026",
31178,
86350,
42706
],
[
"Q3 2026",
67912,
82420,
97416
],
[
"Q4 2026",
82309,
29410,
23473
]
]
}
},
"design": {
"contentBox": false,
"contentAlignment": "left",
"titleAlignment": "left",
"contentDirection": "horizontal"
}
}
]
}Load this config in the gallery's visual editor, or in the Inspector at pptx.dev.