Layout Pattern
Metrics
Highlight a small set of important numbers. Give each number a label and the context needed to interpret it.
How to Use It
Highlight a small set of important numbers. Give each number a label and the context needed to interpret it.
Preview + source
Explore this layout
Show a few different measures with precise labels, units and context.
All people, quotations and business figures in these examples are illustrative.
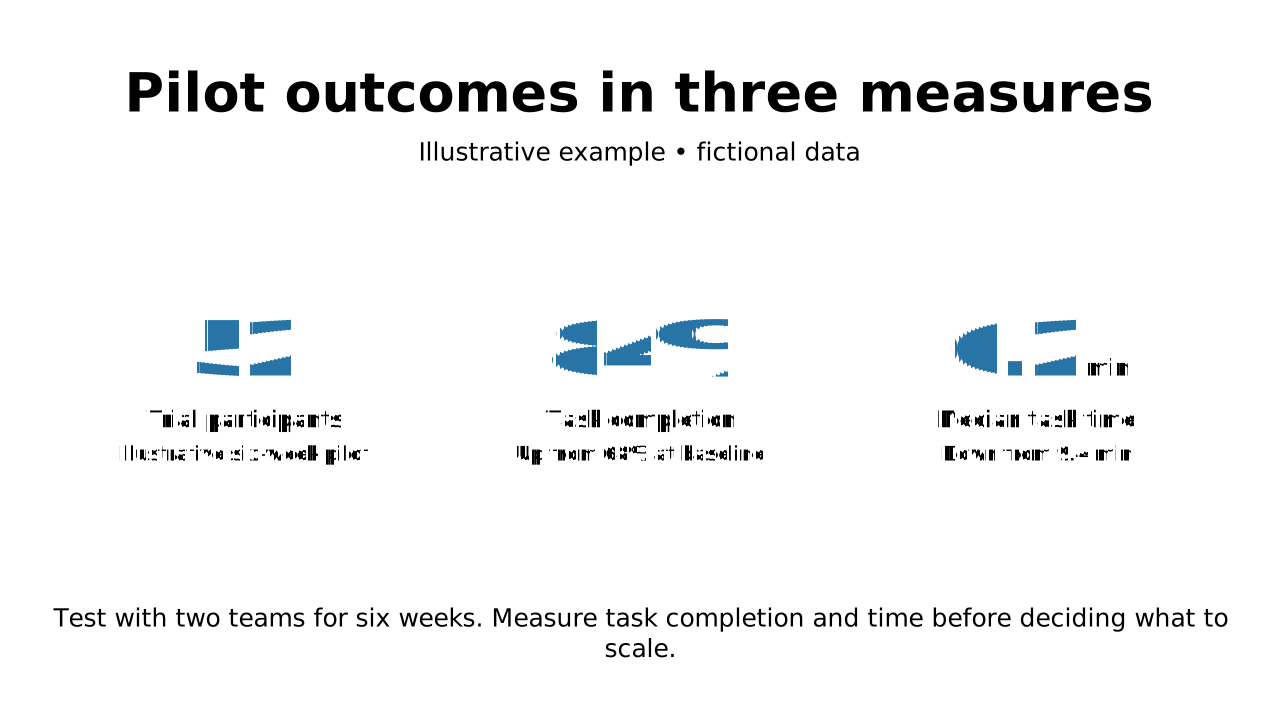
This prepared preview and the OPF describe the same example. Area outlines show measured allocation; toggling them does not change the slide.
Inspect compact default-catalog references. Your host must register the matching catalog; source identifies it without fetching over the network. Copy always includes complete embedded records.
{5 keys
"design": {1 keys
"slides": [1 items
{5 keys
"blocks": [4 items
{2 keys
"metric": {3 keys
{2 keys
"metric": {3 keys
{2 keys
"metric": {4 keys
{2 keys
"design": {1 keys
"catalogs": {1 keys
"default": {1 keys
Layout structure and reference fields
How automatic composition differs
Try dynamic composition
Explore how a text slide reflows as you change its content and shape. These examples use OPF’s shared composition rules; the copied document includes your choices.
All sample text fits within its content areas.
View the complete OPF example
{
  "$schema": "https://openpresentation.org/schema/opf/v1",
  "name": "Dynamic composition example",
  "design": {
    "dimensions": {
      "widthInches": 13.333333333333334,
      "heightInches": 7.5
    }
  },
  "slides": [
    {
      "title": "Let the content find its space",
      "composition": {
        "mode": "auto"
      },
      "blocks": [
        {
          "text": "Start with the decision. State what the audience should understand or do."
        },
        {
          "text": "Show the evidence. Give each supporting idea enough space to be read."
        },
        {
          "text": "Make the next step clear. Keep the action specific and easy to remember."
        }
      ]
    }
  ]
}
Composition rules and examples as JSON · Pagination rules and example JSON
Related Layouts
Similar OPF layout slugs with matching content types, spatial patterns, or presentation use cases.
Numbers
Scorecard
Summarize performance across comparable measures. State the criteria consistently so the audience can assess the result.
/layouts/scorecard
Visuals
Chart beside
Pair a chart with an explanation of its result. Keep the text focused on the pattern or decision supported by the data.
/layouts/chart-beside
Visuals
Image beside
Explain a visual alongside its supporting text. Use the text to direct attention to the meaningful parts of the image.
/layouts/image-beside
Visuals
Table beside
Place a table beside its interpretation. Use the supporting text to explain the conclusion without repeating every cell.
/layouts/table-beside
Groups Of Items
Timeline
Show events or milestones in chronological order. Label each item with a date or stage and a concise description.
/layouts/timeline
Text
Two columns
Place two bodies of content beside each other. Use it for paired explanations or an argument with supporting evidence.
/layouts/two-column