Diagram
Mind Map
Use a mind map to break one idea into themes and sub-points, such as the pillars of a strategy.
mindmapmindmap
First line
The first word of the source, mindmap, names the Mermaid family; the rest follows Mermaid's syntax for it.
Alt text
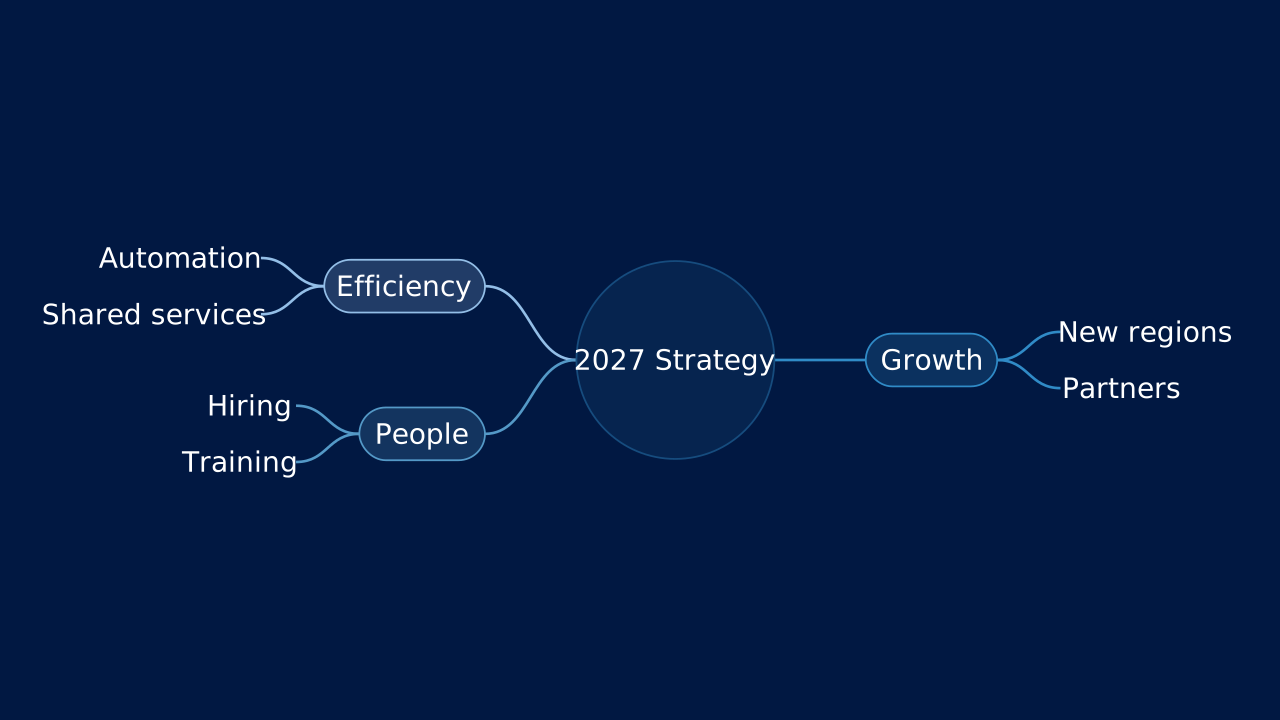
The 2027 strategy has three themes: growth through new regions and partners, efficiency through automation and shared services, and people through hiring and training.
Markdown
A mermaid fence is a diagram; alt is its text alternative.OPF Markdown
# Mind Map

```mermaid alt="The 2027 strategy has three themes: growth through new regions and partners, efficiency through automation and shared services, and people through hiring and training."
mindmap
  root((2027 Strategy))
    Growth
      New regions
      Partners
    Efficiency
      Automation
      Shared services
    People
      Hiring
      Training
```
Layouts That Take It
Give the slide one of these layouts to place the diagram in a region, or none to compose it automatically.
OPF Config
diagrams:mindmapOPF JSON
{
  "$schema": "https://openpresentation.org/schema/opf/v1",
  "name": "PPTX.gallery — diagrams/mindmap",
  "description": "Use a mind map to break one idea into themes and sub-points, such as the pillars of a strategy.",
  "tags": [
    "gallery:diagrams/mindmap"
  ],
  "slides": [
    {
      "id": "gallery-preview-1",
      "layout": "chart",
      "title": "Mind Map",
      "diagram": {
        "source": "mindmap\n  root((2027 Strategy))\n    Growth\n      New regions\n      Partners\n    Efficiency\n      Automation\n      Shared services\n    People\n      Hiring\n      Training",
        "alt": "The 2027 strategy has three themes: growth through new regions and partners, efficiency through automation and shared services, and people through hiring and training."
      }
    }
  ],
  "catalogs": {
    "default": {
      "source": "https://www.pptx.gallery",
      "layouts": {
        "chart": {
          "name": "Chart",
          "summary": "One to six charts, with an optional note.",
          "tags": [
            "Visuals"
          ],
          "direction": "column",
          "regions": [
            {
              "name": "title"
            },
            {
              "name": "charts",
              "accepts": [
                "chart",
                "group",
                "diagram"
              ],
              "role": "primary",
              "flow": "grid"
            },
            {
              "name": "note",
              "size": "auto",
              "accepts": [
                "text"
              ],
              "role": "supporting",
              "flow": "none"
            }
          ],
          "description": "Give a chart enough space to show its evidence. Use the title to state the conclusion and labels to explain the measures.",
          "preview": {
            "vectorSrc": "https://www.pptx.gallery/layout-previews/chart.svg"
          }
        }
      }
    }
  }
}
Open in visual editorOpen in Inspector
Load this config in the gallery's visual editor, or in the Inspector at pptx.dev.