Diagram
Sankey
Use a Sankey diagram to show how a quantity flows and splits between stages, such as visitors becoming trials and paying customers.
sankeysankey
First line
The first word of the source, sankey, names the Mermaid family; the rest follows Mermaid's syntax for it.
Alt text
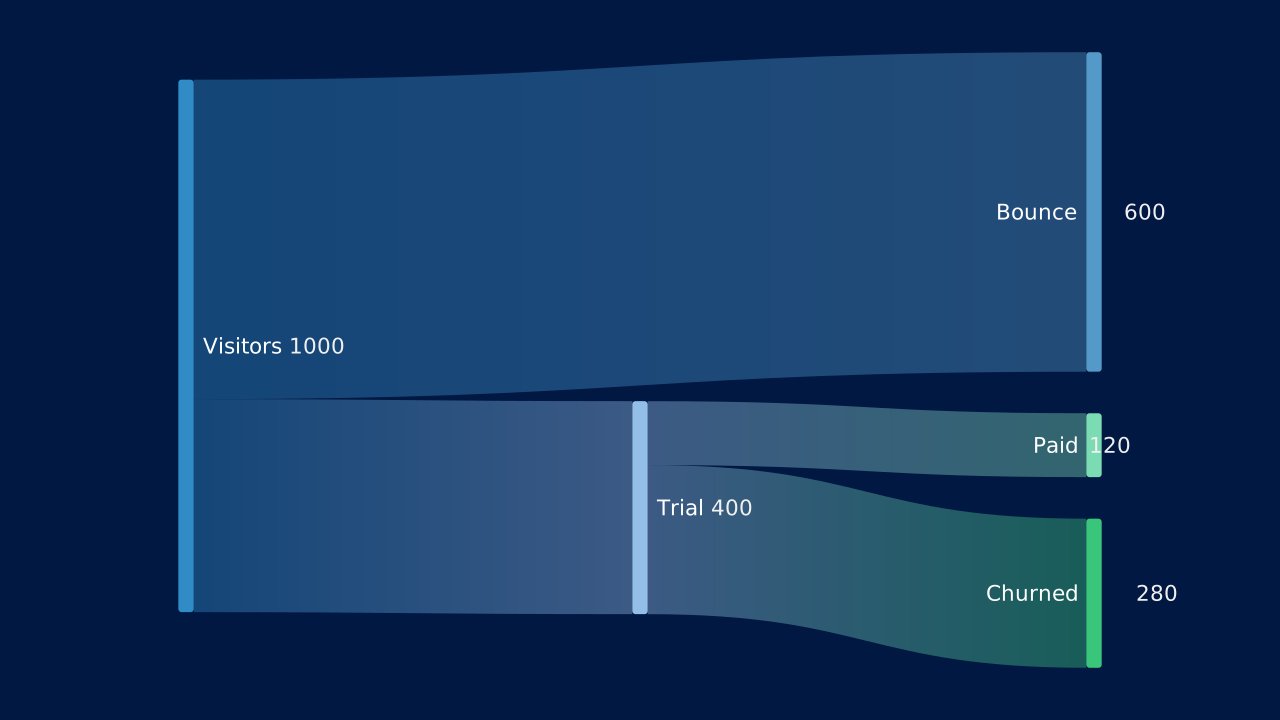
Of 1,000 visitors, 600 bounce and 400 start a trial; of the trials, 120 become paid and 280 churn.
Markdown
A mermaid fence is a diagram; alt is its text alternative.OPF Markdown
# Sankey

```mermaid alt="Of 1,000 visitors, 600 bounce and 400 start a trial; of the trials, 120 become paid and 280 churn."
sankey
  Visitors,Trial,400
  Visitors,Bounce,600
  Trial,Paid,120
  Trial,Churned,280
```
Layouts That Take It
Give the slide one of these layouts to place the diagram in a region, or none to compose it automatically.
OPF Config
diagrams:sankeyOPF JSON
{
  "$schema": "https://openpresentation.org/schema/opf/v1",
  "name": "PPTX.gallery — diagrams/sankey",
  "description": "Use a Sankey diagram to show how a quantity flows and splits between stages, such as visitors becoming trials and paying customers.",
  "tags": [
    "gallery:diagrams/sankey"
  ],
  "slides": [
    {
      "id": "gallery-preview-1",
      "layout": "chart",
      "title": "Sankey",
      "diagram": {
        "source": "sankey\n  Visitors,Trial,400\n  Visitors,Bounce,600\n  Trial,Paid,120\n  Trial,Churned,280",
        "alt": "Of 1,000 visitors, 600 bounce and 400 start a trial; of the trials, 120 become paid and 280 churn."
      }
    }
  ],
  "catalogs": {
    "default": {
      "source": "https://www.pptx.gallery",
      "layouts": {
        "chart": {
          "name": "Chart",
          "summary": "One to six charts, with an optional note.",
          "tags": [
            "Visuals"
          ],
          "direction": "column",
          "regions": [
            {
              "name": "title"
            },
            {
              "name": "charts",
              "accepts": [
                "chart",
                "group",
                "diagram"
              ],
              "role": "primary",
              "flow": "grid"
            },
            {
              "name": "note",
              "size": "auto",
              "accepts": [
                "text"
              ],
              "role": "supporting",
              "flow": "none"
            }
          ],
          "description": "Give a chart enough space to show its evidence. Use the title to state the conclusion and labels to explain the measures.",
          "preview": {
            "vectorSrc": "https://www.pptx.gallery/layout-previews/chart.svg"
          }
        }
      }
    }
  }
}
Open in visual editorOpen in Inspector
Load this config in the gallery's visual editor, or in the Inspector at pptx.dev.