Diagram
Quadrant
Use a quadrant chart to place items on two axes and name the four regions they fall into, such as features by effort and impact.
quadrantquadrantChart
First line
The first word of the source, quadrantChart, names the Mermaid family; the rest follows Mermaid's syntax for it.
Alt text
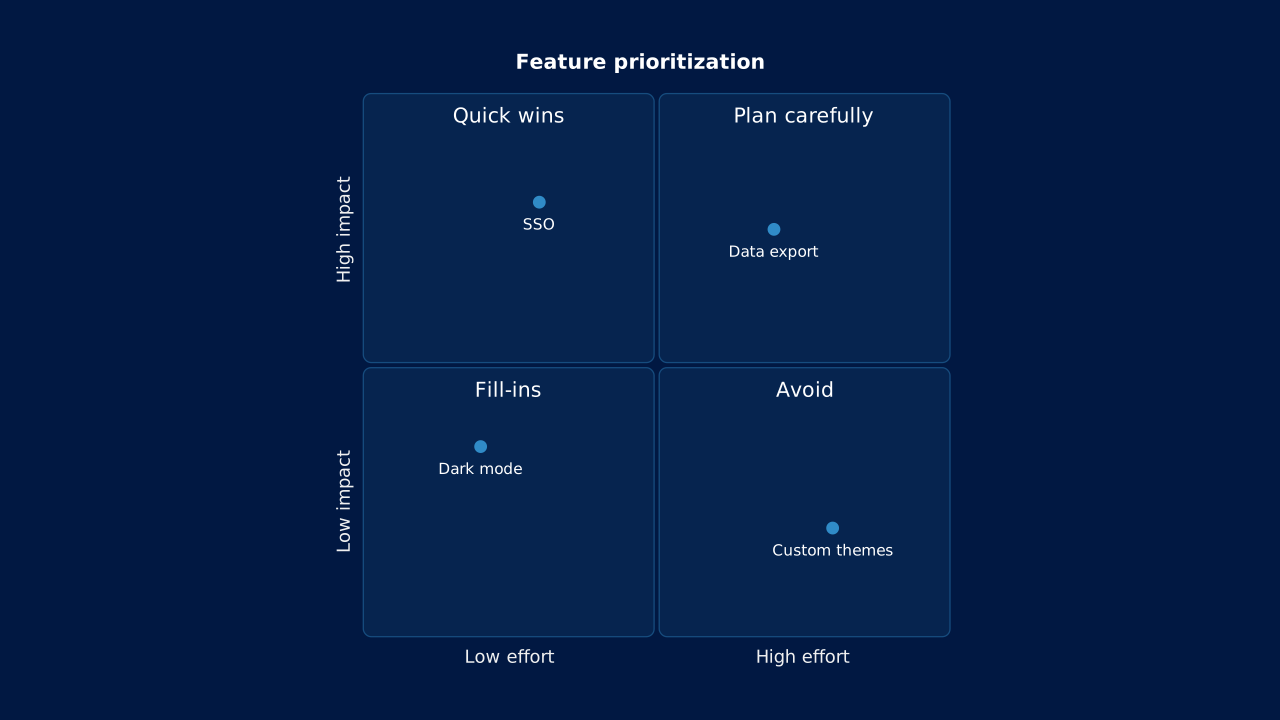
Features by effort and impact: SSO is a quick win, data export needs careful planning, dark mode is a fill-in and custom themes are best avoided.
Markdown
A mermaid fence is a diagram; alt is its text alternative.OPF Markdown
# Quadrant

```mermaid alt="Features by effort and impact: SSO is a quick win, data export needs careful planning, dark mode is a fill-in and custom themes are best avoided."
quadrantChart
  title Feature prioritization
  x-axis Low effort --> High effort
  y-axis Low impact --> High impact
  quadrant-1 Plan carefully
  quadrant-2 Quick wins
  quadrant-3 Fill-ins
  quadrant-4 Avoid
  SSO: [0.3, 0.8]
  Dark mode: [0.2, 0.35]
  Data export: [0.7, 0.75]
  Custom themes: [0.8, 0.2]
```
Layouts That Take It
Give the slide one of these layouts to place the diagram in a region, or none to compose it automatically.
OPF Config
diagrams:quadrantOPF JSON
{
  "$schema": "https://openpresentation.org/schema/opf/v1",
  "name": "PPTX.gallery — diagrams/quadrant",
  "description": "Use a quadrant chart to place items on two axes and name the four regions they fall into, such as features by effort and impact.",
  "tags": [
    "gallery:diagrams/quadrant"
  ],
  "slides": [
    {
      "id": "gallery-preview-1",
      "layout": "chart",
      "title": "Quadrant",
      "diagram": {
        "source": "quadrantChart\n  title Feature prioritization\n  x-axis Low effort --> High effort\n  y-axis Low impact --> High impact\n  quadrant-1 Plan carefully\n  quadrant-2 Quick wins\n  quadrant-3 Fill-ins\n  quadrant-4 Avoid\n  SSO: [0.3, 0.8]\n  Dark mode: [0.2, 0.35]\n  Data export: [0.7, 0.75]\n  Custom themes: [0.8, 0.2]",
        "alt": "Features by effort and impact: SSO is a quick win, data export needs careful planning, dark mode is a fill-in and custom themes are best avoided."
      }
    }
  ],
  "catalogs": {
    "default": {
      "source": "https://www.pptx.gallery",
      "layouts": {
        "chart": {
          "name": "Chart",
          "summary": "One to six charts, with an optional note.",
          "tags": [
            "Visuals"
          ],
          "direction": "column",
          "regions": [
            {
              "name": "title"
            },
            {
              "name": "charts",
              "accepts": [
                "chart",
                "group",
                "diagram"
              ],
              "role": "primary",
              "flow": "grid"
            },
            {
              "name": "note",
              "size": "auto",
              "accepts": [
                "text"
              ],
              "role": "supporting",
              "flow": "none"
            }
          ],
          "description": "Give a chart enough space to show its evidence. Use the title to state the conclusion and labels to explain the measures.",
          "preview": {
            "vectorSrc": "https://www.pptx.gallery/layout-previews/chart.svg"
          }
        }
      }
    }
  }
}
Open in visual editorOpen in Inspector
Load this config in the gallery's visual editor, or in the Inspector at pptx.dev.