Diagram
DOT Pipeline
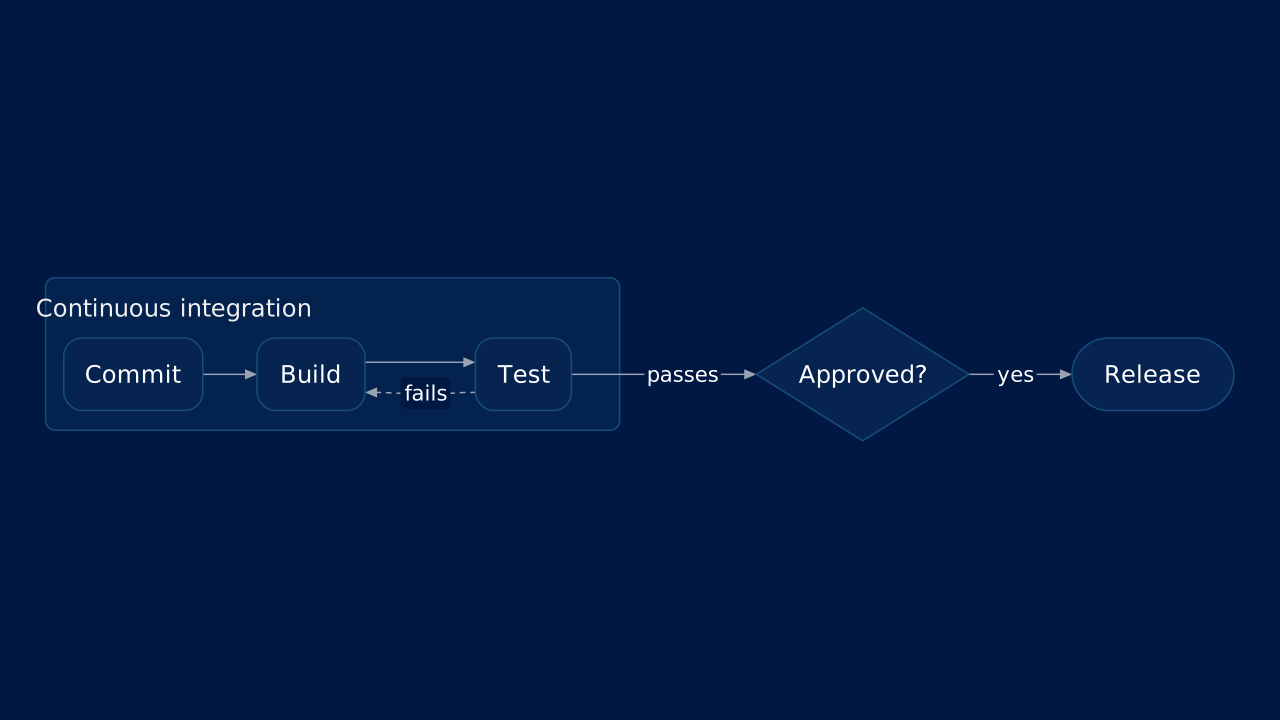
Use a layered DOT graph to show a release pipeline, its continuous integration group and a review decision.
dot-pipelineGraphviz DOT · flowchart
Source syntax
Write one graph or digraph. OPF reads a bounded DOT subset and adapts it to the shared layered flowchart renderer; it does not run Graphviz or reproduce its pixels.
Alt text
A commit is built and tested in continuous integration. Passing tests go to approval and release; failed tests return to build.
Markdown
A dot fence carries Graphviz DOT source; alt is its text alternative.OPF Markdown
# DOT Pipeline

```dot alt="A commit is built and tested in continuous integration. Passing tests go to approval and release; failed tests return to build."
digraph release {
  rankdir=LR
  node [shape=box, style=rounded]
  subgraph cluster_ci {
    label="Continuous integration"
    Commit -> Build -> Test
  }
  Review [shape=diamond, label="Approved?"]
  Test -> Review [label="passes"]
  Test -> Build [label="fails", style=dashed]
  Review -> Release [label="yes"]
  Release [shape=ellipse]
}
```
Layouts That Take It
Give the slide one of these layouts to place the diagram in a region, or none to compose it automatically.
OPF Config
diagrams:dot-pipelineOPF JSON
{
  "$schema": "https://openpresentation.org/schema/opf/v1",
  "name": "PPTX.gallery — diagrams/dot-pipeline",
  "description": "Use a layered DOT graph to show a release pipeline, its continuous integration group and a review decision.",
  "tags": [
    "gallery:diagrams/dot-pipeline"
  ],
  "slides": [
    {
      "id": "gallery-preview-1",
      "layout": "chart",
      "title": "DOT Pipeline",
      "diagram": {
        "source": "digraph release {\n  rankdir=LR\n  node [shape=box, style=rounded]\n  subgraph cluster_ci {\n    label=\"Continuous integration\"\n    Commit -> Build -> Test\n  }\n  Review [shape=diamond, label=\"Approved?\"]\n  Test -> Review [label=\"passes\"]\n  Test -> Build [label=\"fails\", style=dashed]\n  Review -> Release [label=\"yes\"]\n  Release [shape=ellipse]\n}",
        "syntax": "dot",
        "alt": "A commit is built and tested in continuous integration. Passing tests go to approval and release; failed tests return to build."
      }
    }
  ],
  "catalogs": {
    "default": {
      "source": "https://www.pptx.gallery",
      "layouts": {
        "chart": {
          "name": "Chart",
          "summary": "One to six charts, with an optional note.",
          "tags": [
            "Visuals"
          ],
          "direction": "column",
          "regions": [
            {
              "name": "title"
            },
            {
              "name": "charts",
              "accepts": [
                "chart",
                "group",
                "diagram"
              ],
              "role": "primary",
              "flow": "grid"
            },
            {
              "name": "note",
              "size": "auto",
              "accepts": [
                "text"
              ],
              "role": "supporting",
              "flow": "none"
            }
          ],
          "description": "Give a chart enough space to show its evidence. Use the title to state the conclusion and labels to explain the measures.",
          "preview": {
            "vectorSrc": "https://www.pptx.gallery/layout-previews/chart.svg"
          }
        }
      }
    }
  }
}
Open in visual editorOpen in Inspector
Load this config in the gallery's visual editor, or in the Inspector at pptx.dev.